ITEC 3650 - Guided Application in Information Technology and Industry Processes
August 16, 2017
Entity Relationship Diagrams (Part 1)
Identifying Entities
A good database design starts with a list of the data that you want to include in your database and what you want to be able to do with the database later on.

The types of information that are saved in the database are called 'entities'. These entities exist in four kinds: people, things, events, and locations. Everything you could want to put in a database fits into one of these categories. If the information you want to include doesn't fit into these categories, than it is probably not an entity but a property of an entity, an attribute.
For example, imagine that you are creating a website for a store, what kind of information do you have to deal with? In a store you sell your products to customers. The "Store" is a location; "Sale" is an event; "Products" are things; and "Customers" are people. These are all entities that need to be included in your database.
But what other things are happening when selling a product? A customer comes into the store, approaches the salesperson, asks a question and gets an answer. "Salespersons" also participate, and because salespersons are people, we need a salespersons entity.
Identifying Relationships
The next step is to determine the relationships between the entities and to determine the cardinality of each relationship. The relationship is the connection between the entities, just like in the real world: what does one entity do with the other, how do they relate to each other? For example, customers buy products, products are sold to customers, a sale comprises products, a sale happens in a store.
The cardinality shows how much of one side of the relationship belongs to how much of the other side of the relationship. First, you need to state for each relationship, how much of one side belongs to exactly 1 of the other side. For example: How many customers belong to 1 sale?; How many sales belong to 1 customer?; How many sales take place in 1 store?
Did we mention all relationships? There are four entities and each entity has a relationship with every other entity, so each entity must have three relationships, and also appear on the left end of the relationship three times. Above, 12 relationships were mentioned, which is 4*3, so we can conclude that all relationships were mentioned.
Now we'll put the data together to find the cardinality of the whole relationship. In order to do this, we'll draft the cardinalities per relationship. To make this easy to do, we'll adjust the notation a bit, by noting the 'backward'-relationship the other way around:
- Customers → Sales; 1 customer can buy something several times
- Sales → Customers; 1 sale is always made by 1 customer at the time
The second relationship we will turn around so it has the same entity order as the first. Please notice the arrow that is now faced the other way!
- Customers ← Sales; 1 sale is always made by 1 customer at the time
Cardinality exists in four types: one-to-one, one-to-many, many-to-one, and many-to-many. In a database design this is indicated as: 1:1, 1:N, M:1, and M:N. To find the right indication just leave the '1'. If there is a 'many' on the left side, this will be indicated with 'M', if there is a 'many' on the right side it is indicated with 'N'.
- Customers → Sales; 1 customer can buy something several times; 1:N.
- Customers ← Sales; 1 sale is always made by 1 customer at the time; 1:1.
The true cardinality can be calculated through assigning the biggest values for left and right, for which 'N' or 'M' are greater than '1'. In this example, in both cases there is a '1' on the left side. On the right side, there is a 'N' and a '1', the 'N' is the biggest value. The total cardinality is therefore '1:N'. A customer can make multiple 'sales', but each 'sale' has just one customer.
If we do this for the other relationships too, we'll get:
- Customers → Sales; → 1:N
- Customers → Products; → M:N
- Customers → Stores; → M:N
- Sales → Products; → M:N
- Stores → Sales; → 1:N
- Stores → Products; → M:N
Glossary
- Attributes - detailed data about an entity, such as price, length, name
- Cardinality - the relationship between two entities, in figures. For example, a person can place multiple orders.
- Entities - abstract data that you save in a database. For example: customers, products.
- Foreign key (FK) - a referral to the Primary Key of another table. Foreign Key-columns can only contain values that exist in the Primary Key column that they refer to.
- Key - a key is used to point out records. The most well-known key is the Primary Key (see Primary Key).
- Normalization - A flexible data model needs to follow certain rules. Applying these rules is called normalizing.
- Primary key (PK) - one or more columns within a table that together form a unique combination of values by which each record can be pointed out separately. For example: customer numbers, or the serial number of a product.
- Primary key/Foreign key (PF) - The foreign key of an entity can also be part of the primary key, in that case the attribute will be indicated with 'PF' behind its name. This is usually the case with the link-entities, because you usually link two instances only once together.
August 21, 2017
Entity Relationship Diagrams (Part 2)
Signup with Lucid Charts
Signup for a free educational account with Lucid Charts. Following the instructions at the bottom of page where it says: "Free for Individual Teachers & Students"
Cardinality - Crowsfeet Notation
Relationships have two indicators. The first one (often called multiplicity) refers to the maximum number of times that an instance of one entity can be associated with instances in the related entity. It can be one or many.
The second describes the minimum number of times one instance can be related to others. It can be zero or one, and accordingly describes the relationship as optional or mandatory.
The combination of these two indicators is always in a specific order. Placed on the outside edge of the relationship, the symbol of multiplicity comes first. The symbol indicating whether the relationship is mandatory or optional is shown after the symbol of multiplicity.

In crow’s foot notation:
- A multiplicity of one and a mandatory relationship is represented by a straight line perpendicular to the relationship line.
- A multiplicity of many is represented by the three-pronged ‘crow-foot’ symbol.
- An optional relationship is represented by an empty circle.
This result in four possible relationships:
- zero or many
- one or many
- one and only one
- zero or one
A good database design starts with a list of the data that you want to include in your database and what you want to be able to do with the database later on.

Between the entities there may be a mutual dependency. This means that the one item cannot exist if the other item does not exist. For example, there cannot be a sale if there are no customers, and there cannot be a sale if there are no products.
The relationships Sales → Customers, and Sales → Products are mandatory, but the other way around this is not the case. A customer can exist without sale, and also a product can exist without sale. This is of importance for the next step.
Redundant Relationships
Sometimes in your model you will get a 'redundant relationship'. These are relationships that are already indicated by other relationships, although not directly.
In the case of our example there is a direct relationships between customers and products. But there are also relationships from customers to sales and from sales to products, so indirectly there already is a relationship between customers and products through sales. The relationship 'Customers ↔ Products' is made twice, and one of them is therefore redundant. In this case, products are only purchased through a sale, so the relationships 'Customers ↔ Products' can be deleted. The model will then look like this:

Solving Many-to-Many Relationships
Many-to-many relationships (M:N) are not directly possible in a database. What a M:N relationship says is that a number of records from one table belongs to a number of records from another table. Somewhere you need to save which records these are and the solution is to split the relationship up in two one-to-many relationships.
This can be done by creating a new entity that is in between the related entities. In our example, there is a many-to-many relationship between sales and products. This can be solved by creating a new entity: sales-products. This entity has a many-to-one relationship with Sales, and a many-to-one relationship with Products. In logical models this is called an associative entity and in physical database terms this is called a link table or junction table.

In the example there are two many-to-many relationships that need to be solved: 'Products ↔ Sales', and 'Products ↔ Stores'. For both situations there needs to be created a new entity, but what is that entity?
For the Products ↔ Sales relationship, every sale includes more products. The relationship shows the content of the sale. In other words, it gives details about the sale. So the entity is called 'Sales details'. You could also name it 'sold products'.
The Products ↔ Stores relationship shows which products are available in which the Stores, also known as 'stock'. Our model would now look like this:

Identifying Attributes
The data elements that you want to save for each entity are called 'attributes'.
About the products that you sell, you want to know, for example, what the price is, what the name of the manufacturer is, and what the type number is. About the customers you know their customer number, their name, and address. About the Stores you know the location code, the name, the address. Of the sales you know when they happened, in which store, what products were sold, and the sum total of the sale. Of the Salesperson you know his staff number, name, and address. What will be included precisely is not of importance yet; it is still only about what you want to save.
Derived Data
Derived data is data that is derived from the other data that you have already saved. In this case the 'sum total' is a classical case of derived data. You know exactly what has been sold and what each product costs, so you can always calculate how much the sum total of the sales is. So really it is not necessary to save the sum total.
So why is it saved here? Well, because it is a sale, and the price of the product can vary over time. A product can be priced at $10 today and at $8 next month, and for your administration you need to know what it cost at the time of the sale, and the easiest way to do this is to save it here.
Glossary
- Attributes - detailed data about an entity, such as price, length, name
- Cardinality - the relationship between two entities, in figures. For example, a person can place multiple orders.
- Entities - abstract data that you save in a database. For example: customers, products.
- Foreign key (FK) - a referral to the Primary Key of another table. Foreign Key-columns can only contain values that exist in the Primary Key column that they refer to.
- Key - a key is used to point out records. The most well-known key is the Primary Key (see Primary Key).
- Normalization - A flexible data model needs to follow certain rules. Applying these rules is called normalizing.
- Primary key (PK) - one or more columns within a table that together form a unique combination of values by which each record can be pointed out separately. For example: customer numbers, or the serial number of a product.
- Primary key/Foreign key (PF) - The foreign key of an entity can also be part of the primary key, in that case the attribute will be indicated with 'PF' behind its name. This is usually the case with the link-entities, because you usually link two instances only once together.
Using Lucid Charts, try to reproduce "Figure 2: Relationships between entities"
August 23, 2017
Entity Relationship Diagrams (Part 3)
Primary Keys
A primary key (PK) is one or more data attributes that uniquely identify an entity. A key that consists of two or more attributes is called a composite key. All attributes part of a primary key must have a value in every record (which cannot be left empty) and the combination of the values within these attributes must be unique in the table.
In the example there are a few obvious candidates for the primary key. Customers all have a customer number, products all have a unique product number and the sales have a sales number. Each of these data is unique and each record will contain a value, so these attributes can be a primary key. Often an integer column is used for the primary key so a record can be easily found through its number.
Link-entities usually refer to the primary key attributes of the entities that they link. The primary key of a link-entity is usually a collection of these reference-attributes. For example in the Sales_details entity we could use the combination of the PK's of the sales and products entities as the PK of Sales_details. In this way we enforce that the same product (type) can only be used once in the same sale. Multiple items of the same product type in a sale must be indicated by the quantity.
In the ERD the primary key attributes are indicated by the text 'PK' behind the name of the attribute. In the example only the entity 'store' does not have an obvious candidate for the PK, so we will introduce a new attribute for that entity: storenumber.
Foreign Keys
The Foreign Key (FK) in an entity is the reference to the primary key of another entity. In the ERD that attribute will be indicated with 'FK' behind its name. The foreign key of an entity can also be part of the primary key, in that case the attribute will be indicated with 'PF' behind its name. This is usually the case with the link-entities, because you usually link two instances only once together (with 1 sale only 1 product type is sold 1 time).
If we put all link-entities, PK's and FK's into the ERD, we get the model as shown below. Please note that the attribute 'products' is no longer necessary in 'Sales', because 'sold products' is now included in the link-table. In the link-table another field was added, 'quantity', that indicates how many products were sold. The quantity field was also added in the stock-table, to indicate how many products are still in store.

Defining the Attribute's Data Type
Now it is time to figure out which data types need to be used for the attributes. There are a lot of different data types. A few are standardized, but many databases have their own data types that all have their own advantages. Some databases offerthe possibility to define your own data types, in case the standard types cannot do the things you need.
Okay, time for a crash course:
The standard data types that every database knows, and are most-used, are: CHAR, VARCHAR, TEXT, FLOAT, DOUBLE, and INT. Normally, we use signed integers instead of unsigned integers.
Text:
- CHAR(length) - includes text (characters, numbers, punctuations...). CHAR has as characteristic that it always saves a fixed amount of positions. If you define a CHAR(10) you can save up to ten positions maximum, but if you only use two positions the database will still save 10 positions. The remaining eight positions will be filled by spaces (max 255 characters).
- VARCHAR(length) - includes text (characters, numbers, punctuation...). VARCHAR is the same as CHAR, the difference is that VARCHAR only takes as much space as necessary (max 255 characters).
- TEXT - can contain large amounts of text (max 65,535 characters).
- MEDIUMTEXT - can contain large amounts of text (max 16,777,215 characters).
- LONGTEXT - can contain large amounts of text (max 4,294,967,295 characters).
Numbers:
- TINYINT - contains a positive or negative whole number -128 to 127 SIGNED or 0 to 255 UNSIGNED (1 byte)
- SMALLINT - contains a positive or negative whole number -32768 to 32767 SIGNED or 0 to 65535 UNSIGNED (2 bytes)
- MEDIUMINT - contains a positive or negative whole number -8388608 to 8388607 SIGNED or 0 to 16777215 UNSIGNED (3 bytes)
- INT - contains a positive or negative whole number -2147483648 to 2147483647 SIGNED or 0 to 4294967295 UNSIGNED (4 bytes)
- BIGINT - contains a positive or negative whole number -9223372036854775808 to 9223372036854775807 SIGNED or 0 to 18446744073709551615 UNSIGNED (8 bytes)
- FLOAT(size,d) - A number with a floating decimal point. The maximum number of digits may be specified in the size parameter. The maximum number of digits to the right of the decimal point is specified in the d parameter (4 bytes, approximately 7 significant digits).
- DOUBLE(size,d) - A number with a floating decimal point. The maximum number of digits may be specified in the size parameter. The maximum number of digits to the right of the decimal point is specified in the d parameter (8 bytes, approximately 14 significant digits).
Date and Time:
- DATE - A date. Format: YYYY-MM-DD Note: The supported range is from '1000-01-01' to '9999-12-31' (3 bytes)
- DATETIME - A date and time combination. Format: YYYY-MM-DD HH:MI:SS Note: The supported range is from '1000-01-01 00:00:00' to '9999-12-31 23:59:59' (5 bytes)
- TIMESTAMP - number of seconds since the Unix epoch ('1970-01-01 00:00:00' UTC). Format: YYYY-MM-DD HH:MI:SS Note: The supported range is from '1970-01-01 00:00:01' UTC to '2038-01-09 03:14:07' UTC (4 bytes). In an INSERT or UPDATE query, the TIMESTAMP automatically set itself to the current date and time.
- TIME - A time. Format: HH:MI:SS Note: The supported range is from '-838:59:59' to '838:59:59' (3 bytes)
- YEAR - A year in two-digit or four-digit format. Note: Values allowed in four-digit format: 1901 to 2155. Values allowed in two-digit format: 70 to 69, representing years from 1970 to 2069 (1 byte)
Other types:
- BLOB - for binary data such as files (max 65,535 characters).
- MEDIUMBLOB - for binary data such as files (max 16,777,215 characters).
- LARGEBLOB - for binary data such as files (max 4,294,967,295 characters).
For our example the data types are as follows:

Glossary
- Attributes - detailed data about an entity, such as price, length, name
- Cardinality - the relationship between two entities, in figures. For example, a person can place multiple orders.
- Entities - abstract data that you save in a database. For example: customers, products.
- Foreign key (FK) - a referral to the Primary Key of another table. Foreign Key-columns can only contain values that exist in the Primary Key column that they refer to.
- Key - a key is used to point out records. The most well-known key is the Primary Key (see Primary Key).
- Normalization - A flexible data model needs to follow certain rules. Applying these rules is called normalizing.
- Primary key (PK) - one or more columns within a table that together form a unique combination of values by which each record can be pointed out separately. For example: customer numbers, or the serial number of a product.
- Primary key/Foreign key (PF) - The foreign key of an entity can also be part of the primary key, in that case the attribute will be indicated with 'PF' behind its name. This is usually the case with the link-entities, because you usually link two instances only once together.
Review: Crash Course in Binary Numbers
August 28, 2017
Entity Relationship Diagrams (Part 4)
Normalization
Normalization makes your data model flexible and reliable. It does generate some overhead because you usually get more tables, but it enables you to do many things with your data model without having to adjust it.
Normalization, the First Form
The first form of normalization states that there may be no repeating groups of columns in an entity. We could have created an entity 'sales' with attributes for each of the products that were bought. This would look like this:

What is wrong about this is that now only 3 products can be sold. If you would have to sell 4 products, than you would have to start a second sale or adjust your data model by adding 'product4' attributes. Both solutions are unwanted. In these cases you should always create a new entity that you link to the old one via a one-to-many relationship.

Normalization, the Second Form
The second form of normalization states that all attributes of an entity should be fully dependent on the whole primary key. This means that each attribute of an entity can only be identified through the whole primary key. Suppose we had the date in the Sales_details entity:

This entity is not according the second normalization form, because in order to be able to look up the date of a sale, I do not have to know what is sold (productnumber), the only thing I need to know is the sales number. This was solved by splitting up the tables into the sales and the Sales_details table:

Now each attribute of the entities is dependent on the whole PK of the entity. The date is dependent on the sales number, and the quantity is dependent on the sales number and the sold product.
Normalization, the Third Form
The third form of normalization states that all attributes need to be directly dependent on the primary key, and not on other attributes. This seems to be what the second form of normalization states, but in the second form is actually stated the opposite. In the second form of normalization you point out attributes through the PK, in the third form of normalization every attribute needs to be dependent on the PK, and nothing else.

In this case the price of a loose product is dependent on the ordering number, and the ordering number is dependent on the product number and the sales number. This is not according to the third form of normalization. Again, splitting up the tables solves this.

Normalization, More Forms
There are more normalization forms than the three forms mentioned above, but those are not of great interest for the average user. These other forms are highly specialized for certain applications. If you stick to the design rules and the normalization, you will create a design that works great for most applications.
Normalized Data Model
If you apply the normalization rules, you will find that the 'manufacturer' in the product table should also be a separate table:

Glossary
- Attributes - detailed data about an entity, such as price, length, name
- Cardinality - the relationship between two entities, in figures. For example, a person can place multiple orders.
- Entities - abstract data that you save in a database. For example: customers, products.
- Foreign key (FK) - a referral to the Primary Key of another table. Foreign Key-columns can only contain values that exist in the Primary Key column that they refer to.
- Key - a key is used to point out records. The most well-known key is the Primary Key (see Primary Key).
- Normalization - A flexible data model needs to follow certain rules. Applying these rules is called normalizing.
- Primary key (PK) - one or more columns within a table that together form a unique combination of values by which each record can be pointed out separately. For example: customer numbers, or the serial number of a product.
- Primary key/Foreign key (PF) - The foreign key of an entity can also be part of the primary key, in that case the attribute will be indicated with 'PF' behind its name. This is usually the case with the link-entities, because you usually link two instances only once together.
Create an ERD system that describes the class registraton process at UALR. This system should include students, instructors, classrooms, course catalog, and registration for courses. Your system should support a student signing up for muliple courses, a course can have mulitple instructors, courses can have multiple students, and courses can have multiple sections. The resulting system should be in 3rd normal form.
Hint: on the UALR Website:
- Do a class search and look at the available courses. Click on a course to see the information listed about a course.
- Download the current course catalog and see the course informaton
August 30, 2017
Entity Relationship Diagrams (Part 5)
- Continue Work on ERD Assignment.
- You should have at least the following entities:
- Students
- Catalog
- Semester
- Classroom
- Department
- College
- Instructor
- Course Resource
September 4, 2017
Labor Day
- Labor Day - No Class
September 6, 2017
Entity Relationship Diagrams (Part 6)
- Continue Work on ERD Assignment.
- You should have at least the following entities:
- Students
- Catalog
- Semester
- Classroom
- Department
- College
- Instructor
- Course Resource
September 11, 2017
SQL Select Statement
- SQL Home
- SQL Introduction
- SQL Syntax
- SQL Select
- SQL Distinct
- SQL Where
- SQL And/Or
- SQL Order By
- SQL Select Top
- SQL Like
- SQL Wildcards
- SQL In Operator
- SQL Between Operator
Try to create the following SQL statements
- Find the customers that are in Stuttgart Germany or Berlin Germany. Show the Customer Name and Contact Name. Sort by city, then contact name
- Find the products that are packaged 24 to a box and has a price greater than $15 and less than $20. Show the Product Name and Price. Sort by descending price.
- Find the Employees that have a BA and were born beform 1970. Sort by Last Name then First Name. Show the Name of the Employee
September 13, 2017
SQL Insert, Update, and Delete Statements
Try to create the following SQL Statements:
- Insert a new employee, John Smith, born on July 4, 1976
- Update John Smith's Notes Field with "Graduated BA Accounting from UALR"
- Delete John Smith from the Employees
September 18, 2017
SQL Joins
- SQL Joins
- SQL Inner Join
- SQL Left Join - Remember that you get ALL of the records from the left argument
- SQL Right Join - Remember that you get ALL of the records from the right argument
- SQL Null Values
Try to create the following SQL Statements:
- Join all tables related to an Order
- Find all of the Customers that have not made an order
September 20, 2017
SQL Joins
Try to create the following SQL Statements:
- Find the Dates where more than one order was made
- Calculate the Total for Each Order
- Calculate the Total Products Sold for Each Day in December 1996
September 25, 2017
Introduction to MySQL
Getting Started with Cloud 9:
- Login to you email and locate the invitation to join Cloud 9. Click on the link.
- You will be asked to enter a username, email, and password
- Click on add a new workspace. Give the workspace a name of itecruby. Use a type of "PHP, Apache, and MySQL"
- Note the files in your directory structure. Since Apache is running, you can access the webserver at https://<yourworkspace>-<yourusername>.c9users.io, such as https://itecruby-blbauer.c9users.io
- On the "BASH" tab, enter the following: see https://community.c9.io/t/setting-up-phpmyadmin/1723 for more documentation.
- mysql-ctl install - This will install the MySQL database. Be sure you run this only one time, else it will delete all of the MySQL databases. You will get a prompt, but just be aware of what it is doing.
- phpmyadmin-ctl install - This will install phpmyadmin, which is a web tool to administer the MySQL database.
- mysql-ctl start - Make sure that MySQL is started
- You can access the control panel at https://<yourworkspace>-<yourusername>.c9users.io/phpmyadmin, such as https://itecruby-blbauer.c9users.io/phpmyadmin. When prompted for credentials, use your username and a blank password.
- Do not delete any of the existing databases in MySQL. They are needed to run Cloud 9 and MySQL.
- To close your workspace, click on your avatar and select logoff.
Review the following:
- SQL Create Database
- SQL Drop Database
- SQL Create Table
- SQL Drop Table
- SQL Alter Table
- SQL Constraints
- SQL Not Null
- SQL Unique
- SQL Primary Key
- SQL Foreign Key
- SQL Check
- SQL Default
- SQL Create Index
- SQL Drop
- SQL Auto Increment
- SQL Dates
- SQL DB Data Types
- Mockaroo - a great way to generate test data
September 27, 2017
Managing MySQL Tables
Hint: When using phpMyAdmin, use the "back tic" mark (key is located to the left of the Number 1 on your keyboard) when the table name or the column name contains a blank, as in:
- Select * from `Order Details`
In Class Assignment - Open myPHPAdmin and navigate to your database. Locate and rund the MySQL procedure that createa the Northwind database in https://code.google.com/archive/p/northwindextended/downloads. Create the following queries:
- Find the customers that are in Stuttgart Germany or Berlin Germany. Show the Customer Name and Contact Name. Sort by city, then contact name.
- Find the Employees that have a BA and were born beform 1970. Sort by Last Name then First Name. Show the Name of the Employee
- For each order, show the Order ID and the Total for each order. Use the Unit Price in the Products Table for your calculations.
October 2, 2017
Reporting
- https://www.digitaltrends.com/computing/how-to-zip-and-unzip-files-on-a-chromebook/ - How to handle ZIP files on your Chromebook
- Download and Install Reportico 4.6 at http://reportico.org
- Unzip the file and rename the root folder to "reportico"
- In the Reportico folder, add the folder "templates_c"
- Upload the Reportico root folder to the root of you Cloud 9 Project
- Right Click the Reportico Folder and add the folder "templates_c"
- You can access Reportico at "https://<yourproject>-<yourusername>.c9users.io/reportico
- Enter "admin" for your design password
- Create a Nortwind project and configure it as follow:

- Create a Report
- Using myPHPAdmin, create select statement that selects fields in the Customers Table. Use this SQL statement as a basis for your Reportico Customer Report. You will have to remove the "back tic" marks. Your SQL should be: SELECT `CustomerID`, `CompanyName`, `ContactName`, `ContactTitle`, `Address`, `City`, `Region`, `PostalCode`, `Country`, `Phone`, `Fax` FROM `Customers` WHERE 1 = 1
- Note that Reportico always requires a "where" clause. If you do not need a "where" clause, then use "where 1=1" which is always true.
- Add report sort and paging
- Add a lookup criteria that where you type in a value
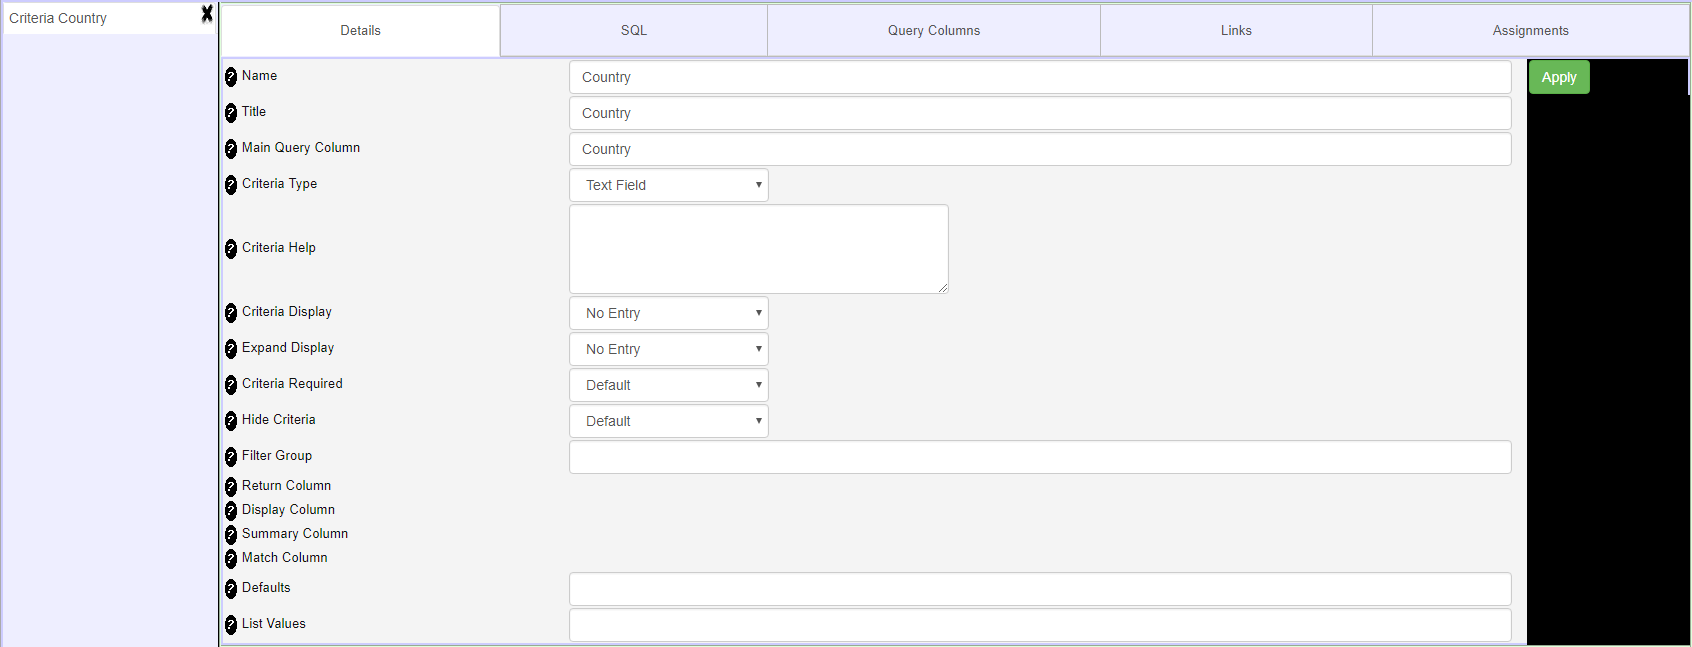
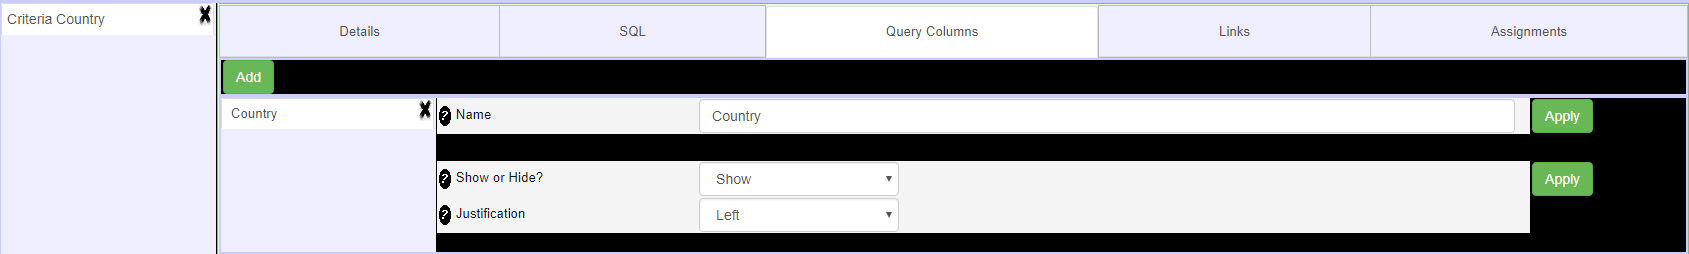
- Now modify your report so that the Country paramenter looks up all the possible countries for selection
- Criteria Details Tab

- Criteria SQL Tab

- Criteria Query Columns Tab
October 4, 2017
Reporting
- Start a new report called Country Total. Use the following SQL for Northwind. It selects all of the orders, joins to order details to get quantity, joins to products to get Unit Price, and joins to Customers to get Country. Click the SQL tab and past the SQL. Check to make sure that the report runs.
SELECT Customers.CompanyName AS CompanyName,
       Customers.Country AS Country,
       FORMAT(SUM((Quantity * Products.UnitPrice)), 2) AS Total
FROM Orders
INNER JOIN  `Order Details` ON Orders.OrderID =  `Order Details`.OrderID
INNER JOIN Products ON  `Order Details`.ProductID = Products.ProductID
INNER JOIN Customers ON Customers.CustomerID = Orders.CustomerID
GROUP BY Orders.CustomerID
ORDER BY Customers.Country
- Go to the Admin Menu and select Configure Parameters. Uncheck Safe Design Mode
- Click the Columns Tab and add "CountryTotals" and "GrandTotals" columns
- Click the Assignments tab
- Add a column, and edit it
- Assign: CountryTotals
- Expression: sum({Total},{Country})
- Click the Assignments tab
- Add a column, and edit it
- Assign: GrandTotals
- Expression: sum({Total})
- Click on the Groups tab
- Add a Group
- Click Details and set the Grop On Column to "REPORT_BODY"
- Click Trailers, add a trailer, and set the Trailer Display Column to "Total" and the Group Trailer Value Column to GrandTotal
- Click on the Groups tab
- Add a Group
- Click Details and set the Grop On Column to Country
- Click Trailers, add a trailer, and set the Trailer Display Column to "Total" and the Group Trailer Value Column to CountryTotals
In-Class Practice
Create a Report that joins Categories with products. Display the Category Name then the product names and UnitPrices associated withing the category. At the end of each category, display the Average UnitPrice for that Category.
October 9, 2017
REST API
JavaScript Review
- Javascipt Calculator
- AJAX and JQuery
Using an API
API's (Application Programming Interface) is a documentation about the way in which you can access and manipulate data. While there is no set rules, many interfaces are beginning to standardize on REST and JSON.
JSON
JSON (JavaScript Object Notation) is a typical standard used to exchange data between a browser and a server. The data is returned as JSON string. Once we have a JSON String, we can convert it to a JSON object using JSON Parse
REST
REST (Representations State Transfer) provides a standardized way to manipulate a database using URL's:
- Return all rows in a table: Method="GET" - /tablename - returns a JSON Object
- Return a specific row in a table: Method="GET" - /tablename/PKID - returns a JSON Object
- Insert a row into a table: Method="POST" - /tablename, JSON object containing data
- Update a row in a table: Method="PUT" - /tablename/PKID, JSON object containing data
- Deata a row in a table: Method="DELETE" - /tablename/PKID
- See https://github.com/mevdschee/php-crud-api and Book about REST Services for more documentation
Installing a REST/JSON Example
- Download contacts.zip, extract it, and upload the contacts folder to your website
- Edit restapi.php and locate the following code:
 $api = new PHP_CRUD_API(array(
 	'dbengine'=>'MySQL',
 	'hostname'=>'127.0.0.1',
 	'username'=>'blbauer',
 	'password'=>'',
 	'database'=>'Contacts',
 	'charset'=>'utf8'
 ));
 $api->executeCommand();
- Change the username to your database username and change the database to your Contacts database. Both of these parameter are case sensitive.
- You can test your API by navigating to: https://itecruby-blbauer.c9users.io/contacts/restapi.php/Contacts/1. (Substitute your Cloud 9 URL). You should see a JSON dump of Record 1
- Locate /assets/scripts/validatecontact.js. Find the RESTBaseURL definition at "https://itecruby-blbauer.c9users.io/contacts/restapi.php". Change the URL to match your Cloud 9 URL. (The URL is case-sensitive).
- Test your program by navigating to https://itecruby-blbauer.c9users.io/contacts. (Substitute your Cloud 9 URL).
October 11, 2017
REST
Technical Assessment - Restaurant Survey - Due October 23 at the beginning of class
- This is not a group project - This is an individual assignment
- You may use any materials we have covered. You may also ask the instructor for technical help.
- Webpage
- In your Cloud 9 website, create a "restaurant" folder in the root of your website.
- Put your webpage, assets and css in the appropriate folders.
- You must style your form using an exteral CSS stylesheet. The style can be simple, but it must work.
- Your index.html page should be similar to this Survey Form.
- Note that a Excellent rating returns an integer value of 4, Good=3, Average=2, and Dissatified=1.
- All fields are required except those marked optional.
- All fields should be validated.
- The form should store an entry in the "survey" table (see below) using the REST API.
- Database
- Create a database called "restaurant"
- Create a table called "survey" add add table attributes that can accomodate the data in the survey form
- Add a PKID and a Timestamp field for the data/time that the survey was entered.
- Reports
- In a folder called "ReporticoSurvey, install Reportico to your website and connect it to the restaurant database.
- Create a report that displays the data in the table. At the bottom of the report should be the average of each rating.
HTML for a Radio Button

<div id="rates">
  <input type="radio" id="r1" name="Rate" value="Fixed Rate"> Fixed Rate
  <input type="radio" id="r2" name="Rate" value="Variable Rate"> Variable Rate
  <input type="radio" id="r3" name="Rate" value="Multi Rate"> Multi Rate
  <span class="error id="RateError"></span>
</div>

Javascript to ensure that a button was selected

function validateRate() {
    var value = "";
    /* Check each radio button and see if one is checked */
    if (document.getElementById("r1").checked) {
      value = document.getElementById("r1").value;
    }
    if (document.getElementById("r2").checked) {
      value = document.getElementById("r2").value;
    }
    if (document.getElementById("r3").checked) {
      value = document.getElementById("r3").value;
    }
    /* value is blank then no radio button was pressed */
    if (value.trim() == "" ) {
            document.getElementById("RateError").innerHTML = "Rate Required";
            return false;
    }
    else
    {
        document.getElementById("RateError").innerHTML = "";
        return true;
    }
}


Javascirpt to insert value from a radio button into a database

    var myData = {};
    /* If a radio button is checked, then save the value associated with the button */
    if (document.getElementById("r1").checked) {
      myData.Rate = document.getElementById("r1").value;
    }
    if (document.getElementById("r2").checked) {
      myData.Rate = document.getElementById("r2").value;
    }
    if (document.getElementById("r3").checked) {
      myData.Rate = document.getElementById("r3").value;
    }
October 16, 2017
Project Management Overview
Project Documents
http://www.brighthubpm.com/ has several documents useful for small projects:
ProjectManagementDoc.com provides a excellent set of document templates for managing a large projects. These template follow the PMBOK (Project Management Book of Knowledge) strategy and are designed for use with large projects.
- Executive Summary
- Business Objectives
- Project Description
- Project Approach
- Project Controls
October 18, 2017
Project Management - Work Breakdown Structure
Download the Work Breakdown Structure (WBS), which can be found at:
- ProjectManagementDocs.com → Project Planning → Work Breakdown Structure (WBS) → Download Template
- Work Breakdown Structure (WBS) (direct download)
- Work Breakdown Structure (WBS) (locally)
Get Started with the WBS
One of the best ways of project planning involves developing an affinity diagram for all of the requirements in the project. Using two colors of post-it notes and a white board to map out what needs to be done, when and by whom. Simple, but effective.
The affinity diagram process should run something like this:
- Using one color of post-it notes, write down all the milestones that you need to achieve on the way to the project outcome, and number them in chronological order. Stick them all down the left hand side of the board.
- For each milestone, identify any others that need to be achieved first, before that one can be either started or finished (precursors) and write them on the post-it note for that milestone.
- Now on a different color of post-it notes, identify all the tasks that need to be done to achieve each milestone. Use common sense to decide what level of granularity you want to work at. For example, if your overarching project is a recruitment exercise, you’ll want to spell out each step, from preparing job descriptions, through advertising, sifting, interviewing, carrying out checks, and offering the job. However, for a much larger project, you might include a task to ‘recruit project administrator’.
- For each task, identify which milestones they feed and write the milestone number on the post-it for the task. Write the feeder tasks on the post-it for each milestone.
- Identify how long each task (in person-hours) is going to take and write it on the task post-it.
- Identify what resources you need to achieve each task, and write it on the post-it.
- Take pictures of the post-it notes with your camera, as you will need it for the next session
October 23, 2017
Student Project
- Customer Interview
October 25, 2017
Project Management - Using Trello to Schedule Your Project
www.trello.com is a freemium, web-based ect management tool that allows you to take your Work Breakdown Structure and interactively schedule your project. All enterprise project management system, including Microsoft Project, Primavera, and others use the same techniques found in Trello.
Create a Trello Account
Navigate to http://www.trello.com and create an account
Project Leader will lay out the example web project
- Click on Boards and create Sample Web Project
- Next to Boards click on Sample Web Project Team then View Team Page. Add the members of your team, usually their UALR email.
- On the right of the screen, click Show Menu then labels. Edit the labels as follows (be sure to put the number):
- Green Label - 1. Project Initiation
- Yellow Label - 2. Project Planning
- Salmon Label - 3. Project Development
- Red Label - 4. Project Testing
- Purple Label - 5. Project Completion
- Create the following lists and cards within the list:
- Project Complete
- Web Project in Progress
- Project Initiation
- Formulate Questions for Customer (label: Project Initiation)
- Meet with Customer (label: Project Initiation)
- Project Planning
- Create Work Breakdown Structure (label: Project Planning)
- Create Gantt Charts and Project Schedule (label: Project Planning)
- Create Project Management Plan (label: Project Planning)
- Project Development
- Develop theme for website (label: Project Development)
- Create and optimize imagery (label: Project Development)
- Create navigation for website (label: Project Development)
- Create webpage A (label: Project Development)
- Create webpage B (label: Project Development)
- Create webpage C (label: Project Development)
- Project Testing
- Final website testing (label: Project Testing)
- Project Completion
- Final website demonstration for customer (label: Project Completion)
- Website installation (label: Project Completion)
- Customer acceptance (label: Project Completion)
- Archive Site Matrials (label: Project Completion)
- On the right, click Show Menu, then Power-Ups , then select Gantt Chart(elegantt). You will have to intall the Chrome extension, close your browser and reopen it, then click the Elegantt symbol in the middle of the screen
- Drag/widen/narrow each task so that it matches your estimated dates
- Assign team members to each task
October 30, 2017
Student Project
- Work on Student Project
November 1, 2017
Student Project
- Work on Student Project
November 6, 2017
Student Project
- Work on Student Project
November 8, 2017
Student Project
- Example of loading the options in a dropdown box from a database using REST.
- Work on Student Project
Novermber 13, 2017
Student Project
- Work on Student Project
November 15, 2017
Student Feedback
- 12:20pm - Alexander, Jordan T.
- 12:28pm - Burton, Gregory P.
- 12:36pm - Carpenter, Michael R.
- 12:44pm - Davis, Willis J.
- 12:52pm - Harris, Joshua
- 1:00pm - Heard, Yancey A.
- 1:08pm - Howard, Jacob R.
- 1:16pm - Lamb, Justin C.
- 1:24pm - Lewis, Christopher
- 1:32pm - Lim, April L.
- 1:40pm - Martinez, Mckenzie Gabrielle M.
- 1:48pm - McCarville, Robert
- 1:56pm - Mina, Merryvonne D.
- 2:04pm - Shelton, Cheyenne N.
- 2:12pm - Stobaugh, Jenette N.
- 2:20pm - Thompson, Trevor G.
- 2:28pm - Tolbert, Alexa L.
- 2:36pm - Underwood, Skylaar R.
- 2:44pm - Whitman, David E.
November 20, 2017
Student Project
- Work on Student Project
November 22, 2017
Thanksgiving Holiday
- Thanksgiving Holiday - No Class
November 27, 2017
Student Project
- Work on Student Project
November 29, 2017
Student Project
- Work on Student Project
December 4, 2017
Student Project Presentation
- Presentations