ITEC 3610 - Introduction to Information Technology and Applications
Events
- In Person Stem Career Fair (Oct 12) - Register at https://ualr.edu/cstem/stem-career-services/
August 24, 2021
Course Orientation
- Review syllabus
- Faculty introductions
- Student introductions
- Get Chromebooks
- Ice-Breaker Exercises
- Bruce Bauer's Website: brucebauer.info
August 26, 2021
Living in the Online World
Introduction to the Internet
Overview of the Internet - Watch: There and Back Again
What is the Internet
The Internet, sometimes called simply "the Net," is a worldwide system of computer networks in which a computer (client) can get information from any other computer (server):
The Internet is based on standards so that computers and software from different vendors can talk to each other. This is known as interoperability.
Every computer in internet is identified by a unique IP address (such as 110.22.33.114) using IPV4 which allows for a little more than 4 billion addresses (32 bit). The Internet is slowly progressing to IPV6, which allows for 3.4 * 1038 addresses (128 bit). This is 3.4 followed by 38 zeros addresses. IPV6 address look like: 1A23:120B:0:0:0:7634:AD01:004D.
Servers are computers that are permanently available on the Internet an always have the same static IP address. These addresses are assigned by the Internet Service Provider (ISP) that houses the server. Blocks of IP addresses and naming conventions
arewere assigned by ICANNClients, such as your computer, tablet, or smart phone are off/on and constantly move around on the internet. They have a dynamic IP address that changes each time you turn on the device. A local server on your network know as a Dynamic Host Configuration Protocol (DHCP) server assigns the address when you turn you device on.
The Internet handles data as packets, each packet containing about 1000 characters. Large amounts of data such as images and moves are broken down into packets. Each packet has a "From" IP address and a "To" IP address, similar to a physical letter that is mailed.
Internet use"two protocol standards to move data packets: TCP and IP. Internet Protocol (IP) is the addressing scheme we just discssed. Transmission Control Protocol (TCP) is responsible for breaking down large data items into packet, and reassembling them reliably on the client. It also handles errors and retries.
Special servers known as Domain Name Servers (DNS) are used to give name to the IP Address so that user can locate a computer by a name. For example, a DNS server will resolve the name http://ualr.edu to 144.167.4.20 to uniquely identify the computer on which this website is hosted.
Routers are devices that control the flow of packets throughout the internet. They can determine the best route for a packet (based on the IP address. They can also block malicious or unwanted internet traffic before it reaches a server.
The internet is designed to operate over many different types of media, such as twisted pair copper, coax cable, fiberoptic lines, and wireless radio transmission (satellite, Wi-Fi, and cellular phone networks. There has been an exponential increase in wireless transmission due to the use of mobile devices (smartphones and tablets). Connections between your smartphone and internet using 4G LTE technology is automatically encrypted. Wi-Fi connections are encrypted only if the wireless access point requires a password (well usually).
What Can You Run on the Internet?
Uniform Resource Locator (URL)
Uniform Resource Locator (URL) refers to a web address which uniquely identifies a document over the internet. See Example.
This document can be a web page, image, audio, video or anything else present on the web.
A URL can consist of:
- Scheme (http:, https:, ftp:, etc)
- Doman Name, consisting of:
- Sub-domain
- Second Level Domain
- Top Level Domain(.com, .net, edu, .info, countrycode, etc,)
- File Path with Page Name (may default to index.html)
- Parameters, each with a name and a value; in the form of "?name1=value1&name2=value2..."
- Anchor, beginning with a "#"
For example, http://ualr.edu/informationtechnology/ is an URL to the index.html which is stored on ualr.edu web server under informationtechnology directory.
Assignment (due next class period): Watch the following videos and exercises.
August 31, 2021
Introduction to Google Drive
- Google Docs
- Types of Google Docs
- Google Documents (similiar to Microsoft Word)
- Google Sheets (similiar to Microsoft Excel)
- Google Presentations (similiar to Microsoft Powerpoint)
- Google Drawings (similiar to Microsoft Paint
- Google Forms (Online fillable form that populates a Google Sheet)
- Create Your First Doc
- Managing Files
- Search
- Sort
- Filter
- Create Folder
- Move, Delete, Rename Files
- Sharing and Collaborating
- Sharing a file with a small group
- Sharing a link
- Publishing to the internet
- The owner of a file automatically has all rights to the file
- Note: - When you create a file, by default it inherits the sharing defined in the containing folder. You can always change the sharing of any file that you own.
- Download and Converting Documents
- Uploading and Converting Documents
You can practice using Google Drive with Applied Digital Skills: Organize Files in Drive
September 2, 2021
Google Documents
- Text Basics
- Insert, Delete, Cut/Paste, Drag/Drop
- Special Characters
- Spelling, Thesaurus
- Find/Replace
- Formatting Text
- Font, Size, Color, Italics, Underline, Strikethough, Superscript, Subscript
- Alignment
- Line/Paragraph Spacing
- Hyperlinks
- Tabs, Margins, Indentation
- Headers, Footers, Page Break
- Tables
- Images
- Demonstration of Sharing Files
Google Slides
Assignment (due next class period): Review the following exercises:
September 7, 2021
Google Sheets
- Getting Started with Google Sheets
- Naming the Sheet
- Cell Naming and Cell Range
- Cell Content
- Text, Number, Dates
- Formatting Cells
- Formulas and Functions
- Select Cell, Insert Content
- Copy and Paste
- Drag/Drop
- Fill Handle
- Modifying Columns, Rows, and Cells
- Modify Cell Width and Height, Autosize
- Insert/Delete Row/Column
- Cell Naming and Cell Range
- Drag Row/Colunn
- Text Wrapping
- Merge Cells
- Freezing Rows/Columns
- Formatting Cells
- Change Font and Size
- Change Text and Color; Bold; Italic
- Horizontal/Vertical Text Alignment
- Cell Borders
- Number Formats
- Simple Formulas
Create "South University Autorama Sales" as follows. See Solution.
- In your shared ITEC amethyst Folder, create a subfolder named ITEC 3610
- In the ITEC 3610 folder, open a new Google Sheet.
- Name your Google Sheet: "South University Autorama Sales"
- In cell A1 enter "South University Autorama Sales
- Merge cells A1 through E1
- In cell A1, change the font to Cambria, size 18, bold, italic
- In cell A1, change the background fill to Light Blue 3
- Center the text in cell A1
- In cell A2 enter "First Quarter Sales by Vehicle Type
- Merge cells A2 through E2
- In cell A2, change the font to Calibri, size 14, bold
- Center the text in cell A2
- Highlight the table below (including the headings), enter Ctrl+C, then click on cell A3, and enter Ctrl+V. Highlight the area you just pasted, and enter "Format", then "Clear Formating"
- Enter the word "Totals" in cells A8 and E3
- Format the vertical and horizontal headers as Calibri, size 11, Bold
- Left justify columns A3:A8
- Center columns B3:E3
- Left justify columns A3:A8
- Right justify columns B4:E8
- Create vertical totals for all columns by entering a formula
- Create horizontal totals by entering a formula
- Format all numbers as Currency
- Place a single line border at the top of Row 8
| Type | January | February | March |
|---|---|---|---|
| Compacts | 347,999.12 | 376,984.92 | 377,540.57 |
| Sedans | 330,373.42 | 289,076.30 | 271,717.67 |
| SUVs | 185,835.76 | 161,446.98 | 140,408.67 |
| Trucks | 309,725.48 | 272,558.89 | 330,373.58 |
September 9, 2021
Importing Data, Charts in Google Sheets
- Commas Separated Values (.csv) Files - Standard
- Generating Test Data - Mockaroo.com
- Import CSV File or Excel File
- Check your automatic conversion setting in Settings and make sure that files are automatically converted
- .CSV files contain data only. They do not contain formulas or formatting. Download this .CSV file and open it with a text editor. Now upload the file into a Google Sheet
- .XLS or .XLST Excel files can be imported with the formulas and formatting. Try downloading your spreadsheet as a .XLSX file, then uploading and converting the file back to a Google Sheet
- Charts in Google Sheets - Starter File
Add a Bar Chart to your "South University Autorama Sales" assignment - See Solution
Review the following topics:
September 14, 2021
Complex Formulas and Cell Reference
- Complex Formulas
- Types of Cell References (Go down to the "Challenge" section and make a copy the example file.)
In your shared Google Sheets Students folder, create "South University Autorama Safety Products" as follows. See Solution.
- In your shared student directory, open a new Google Sheet.
- Name your Google Sheet: "South University Autorama Safety Products"
- In cell A1 enter "South University Autorama Safety Products
- Merge cells A1 through F1
- Change the font to Cambria, size 16, bold, italic
- Change the background fill to Light Green 1
- Center the text in cell A1
- Highlight the table below, enter Ctrl+C, then click on cell A2, and enter Ctrl+V. Highlight the area you just pasted, and enter "Format", then "Clear Formating"
- Enter "Total Retail Value for All Products" in cell A10
- Enter "Total Retail Value" in cell E2
- Enter "Percent of Total Retail Value" in cell F2
- Format the vertical and horizontal headers as Calibri, size 11, bold
- Vertically and horizontally center and word wrap the horizontal headers
- Calculate the total retail value in column E (Quantity times Retail Price)
- Calculate the Total Retail Value for all products in cell E10
- Place a single line at the top of cell E10
- Calculate the Percent of Total Retail value in column F and format as a percent. (Use absolute addressing).
- Format all dollar values as currency
- Add a Pie Chart showing the Percent of Total Retail Value
| Item In Inventory | Quantity | Average Cost | Retail Price |
|---|---|---|---|
| Severe Weather Kit | 50 | 33.50 | 41.95 |
| Emergency Road Kit | 135 | 23.90 | 29.95 |
| First Aid Kit | 75 | 14.30 | 19.96 |
| Road Trip Emergency Kit | 35 | 67.96 | 84.95 |
| Accident Reporting Camera Kit | 35 | 12.00 | 22.95 |
| Premium Auto Safety Kit | 50 | 36.00 | 44.95 |
| Super Flashlight | 50 | 23.30 | 27.95 |
September 16, 2021
Multiple Sheets and What If Analysis
- Using Multiple Sheets
- You can perform calculations using data on another sheet by using the notation:
='SheetName'!A1
As the city grows, the school district must plan for addition students that will enroll in the elementary, middle, and high schools. Create workbook with 3 worksheets containing the following information.
- See Solution
- In your shared student directory, open a new Google Sheet.
- Name your Google Sheet: "Ticket Sales"
- Create 4 sheets and label them
- Park Plaza Mall
- Post Office
- City Hall
- Summary
- Download the following files and import the data into cell A5 on the appropriate sheet. Hint: Use "Replace data starting at selected cell".
- On the Park Plaza sheet, in cell A1 enter "Summer Fair and Arts Festival"
- In cell A2 enter "Ticket Sales - Park Plaza Mall"
- Merge cells A1 through E1 and A2 through E2
- In both cells, change the text to Arial, size 18, bold, italic, orange, centered
- In cells D5 through F5 add the following titles:
- Child Ticket Total
- Adult Ticket Total
- Total Ticket Sales
- Format the cells as Arial, size 10, bold, italic, orange, horizontal/vertical center, wrap
- In cells H6 through H12 add the following titles:
- Child Ticket Price
- Adult Ticket Price
- Child Ticket Total
- Child Ticket Sales
- Adult Ticket Total
- Adult Ticket Sales
- Total Sales
- Format the cells as Arial, size 10, bold, italic, orange
- In cell I6, Enter the child ticket price as "$2.50"
- In cell I7, Enter the adult ticket price as "$5.00"
- Complete the calculations for columns. Be sure to use absolute referenceing
- Complete the summary calculations. Be sure to use sum over the entire column
- Format cells as currency where necessary
- Copy the headings and calculations to the other sheets. Make changes as necessary
- Select the Summary sheet
- In cell A1 enter "Summer Fair and Arts Festival"
- In cell A2 enter "Ticket Sales - Summary"
- Merge cells A1 through C1 and A2 through C2
- In both cells, change the text to Arial, size 18, bold, italic, orange
- In cells B4 through C4 add the following titles:
- Total Sales Child
- Total Sales Adult
- Format the cells as Arial, size 10, bold, italic, orange, horizontal/vertical center, wrap
- In cells A5 through A8 add the following titles:
- Park Plaza Mall
- City Hall
- Post Office
- Total
- Format the cells as Arial, size 10, bold, italic, orange
- Complete the calculations for columns by referencing values from other sheets
- Add a Bar Chart indicating total sales by child and adult in each location
- Format all cells containing currency
As the city grows, the school district must plan for addition students that will enroll in the elementary, middle, and high schools. Create a workbook named Schools with 3 worksheets containing the following information. See Solution
Elementary Schools
| Projected Increase | 2% | 3.5% | 7% | 5% | |
|---|---|---|---|---|---|
| Year | 2016 | 2017 | 2018 | 2021 | 2021 |
| Wyndham | 1350 | ||||
| Warm Creek | 956 | ||||
| Los Seranos | 1175 | ||||
| Hidden Canyon | 1465 | ||||
| Butterfield | 845 |
Middle Schools
| Projected Increase | 4.5% | 5.75% | 3% | 3.5% | |
|---|---|---|---|---|---|
| Year | 2016 | 2017 | 2018 | 2021 | 2021 |
| Townsand | 1194 | ||||
| Canyon Hills | 1575 | ||||
| Los Seranos | 1175 | ||||
| Golden Springs | 1392 |
High Schools
| Projected Increase | 6.0% | 7.5% | 4% | 2.75% | |
|---|---|---|---|---|---|
| Year | 2016 | 2017 | 2018 | 2021 | 2021 |
| Poppy Hills | 2276 | ||||
| Diamond Branch | 3150 |
- On each sheet, create formulas in year column that increase the previous year's enrollment by the projected increase percent. Be sure to use the percentage in the title. Do no hard code the percentage in the formula.
- Calculate totals by year
- Create a vertical bar chart on each sheet with the year on the horizonal axis
- Create a summary sheet that includes the total enrollment by year for each type of school, and calculate totals for each year.
- On the summery sheet, create a vertical bar chart with the year as the horizontal axis showing the total enrollment for each type of school.
September 21, 2021
Count, CountIFS, Sum, SumIFS, Average, AverageIFS, Min, MinIFS, Max, MaxIFS, and Rank Functions
- Google Sheets Functions
- Google Sheets Function List
- Starter File
- You can sum an entire column regardless of length using the notation
=SUM(A:A)where A is any column name. This way you can continually add data without changing the formula. By putting the sum in a sidebar instead of the bottom of a column, you will not have change your formulas that use the value of the SUM. If you have column headers, you can start from below the headers to the bottom of the spreadsheet using=SUM(A4:A), indicating that you want to sum from column A4 to the bottom of the sheet.
- See Solution
- In your shared student directory, open a new Google Sheet.
- Name your Google Sheet: "Jewelry"
- Download JewelryData.csv and import the data into cell A11
- In cells A1 through H2 and A3 through A8, add the titles as shown. Format the Titles as Calibri, size 10, bold, horizontal/vertical center, wrap
- If necessary, create column G. In cell G11, insert a heading "Inventory Value" as Calibri, size 10, bold. In cell G12, insert a formula that calculates the dollar value of the stock item (Quantity in Stock times Retail Price). Duplicate the calculation through the bottom of the spreadsheet.
- In cells B3 through H3, calculate the number of Unique Items in Stock using the COUNT, COUNTIF, or COUNTIFS function. Use the values in rows 1 and 2 as parameters for the selection criteria.
- In cells B4 through H4, calculate the Total Quantity in Stock using the SUM, SUMIF, or SUMIFS function. Use the values in rows 1 and 2 as parameters for the selection criteria.
- In cells B5 through H5, calculate the Total Values in Stock using the SUM, SUMIF, or SUMIFS function. Use the values in rows 1 and 2 as parameters for the selection criteria.
- In cells B6 through H6, calculate the Average Price using the AVERAGE, AVERAGEIF, or AVERAGEIFS function. Use the values in rows 1 and 2 as parameters for the selection criteria.
- In cell B7, calculate the lowest Retail Price (MIN function)
- In cell B8, calculate the highest Retail Price (MAX Function)
- In column H, calculate the rank of the price of each item using the RANK function
- Save your sheet...you will need it for the next class
September 23, 2021
If Statements, Conditional Format, Sparklines, Sorting, Filters
You should have the following assignments completed:
- South University Autorama Sales
- South University Autorama Safety Products
- Ticket Sales
- Schools
- Jewelry (In Progress)
Today's Lecture
- Starter File
- Freezing Rows or Columns
- If Statements
- Conditional Format
- Alternating Colors
- Sparklines
- Sorting and Filters
- See Solution
- If Statement - If necessary, create column H. Using an if statement, display "OK" if the Quantity in stock is greater than or equal to 40, else display "Order".
- Conditional Formatting - If column H contains "OK", make the background color green. If column H contains "Order", make the background color red.
- Sparklines - If necessary, create column I. In Google Sheets Help, look up "Sparkline". Use the formula =SPARKLINE($A12,{"charttype","bar"; "max",100; "color1", "blue"})
- Freeze rows 1-11, and add a filter on row 11 (column headings)
September 28, 2021
String Manipulation
- In Class - Make a local copy of this Spreadsheet
- String Function List
- PROPER(text_to_capitalize) - Capitalizes each word in a specified string.
- VALUE(text) - Converts a string in any of the date, time or number formats that Google Sheets understands into a number.
- TRIM(text) - Removes leading and trailing spaces in a specified string.
- TEXT(number, format) - Converts a number into text according to a specified format.
- SUBSTITUTE(text_to_search, search_for, replace_with, occurrence_number) - Replaces existing text with new text in a string.
- SPLIT(text, delimiter, split_by_each) - Divides text around a specified character or string, and puts each fragment into a separate cell in the row.
- SEARCH(search_for, text_to_search, [starting_at]) - Returns the position at which a string is first found within text.
- RIGHT(string, [number_of_characters]) - Returns a substring from the end of a specified string.
- REPT(text_to_repeat, number_of_repetitions) - Returns specified text repeated a number of times.
- REPLACE(text, position, length, new_text) - Replaces part of a text string with a different text string.
- UPPER(text) - Converts a specified string to uppercase.
- MID(string, starting_at, extract_length) - Returns a segment of a string.
- LOWER(text) - Converts a specified string to lowercase.
- LEN(text) - Returns the length of a string.
- LEFT(string, [number_of_characters]) - Returns a substring from the beginning of a specified string.
- FIXED(number, number_of_places, [suppress_separator]) - Formats a number with a fixed number of decimal places.
- FIND(search_for, text_to_search, starting_at) - Returns the position at which a string is first found within text.
- EXACT(string1, string2) - Tests whether two strings are identical.
- DOLLAR(number, number_of_places) - Formats a number into the locale-specific currency format.
- CONCATENATE(string1, string2) - Appends strings to one another.
- CLEAN(text) - Returns the text with the non-printable ASCII characters removed.
- Examples of Extracting Strings
- Starter File
September 30, 2021
Date/Time Manipulation
- In Class - Make a local copy of this Spreadsheet
- Date Function List
- NOW() - Returns the current date and time as a date value.
- TODAY() - Returns the current date as a date value.
- HOUR(time) - Returns the hour component of a specific time, in numeric format.
- MINUTE(time) - Returns the minute component of a specific time, in numeric format.
- SECOND(time) - Returns the second component of a specific time, in numeric format.
- MONTH(date) - Returns the month of the year a specific date falls in, in numeric format.
- DAY(date) - Returns the day of the month that a specific date falls on, in numeric format.
- YEAR(date) - Returns the year specified by a given date.
- DATE(year, month, day) - Converts a provided year, month, and day into a date.
- TIME(hour, minute, second) - Converts a provided hour, minute, and second into a time.
- DATEVALUE(date_string) - Converts a provided date string in a known format to a date value.
- TIMEVALUE(time_string) - Returns the fraction of a 24-hour day the time represents.
- WEEKDAY(date, type) - Returns a number representing the day of the week of the date provided.
- WEEKNUM(date, [type]) - Returns a number representing the week of the year where the provided date falls.
- DATEDIF - (start_date, end_date, unit) - Calculates the number of days, months, or years between two dates. Units can have the following values:
- "Y": the number of whole years between start_date and end_date.
- "M": the number of whole months between start_date and end_date.
- "D": the number of days between start_date and end_date.
- "MD": the number of days between start_date and end_date after subtracting whole months.
- "YM": the number of whole months between start_date and end_date after subtracting whole years.
- "YD": the number of days between start_date and end_date, assuming start_date and end_date were no more than one year apart.
October 5, 2021
Notes, Validation, Protect, Named Ranges
- Hints for Cells (Notes)
- Validation
- Protecting Sheets See Example (Make a local copy)
- Using a named range of cells
VLookup, Lookup, Index, Match
Getting Set Up
- In your shared directory, create a Google Sheet and call it "Lookups". Import the following .csv files and name the sheets the same as the file name:
VLookup
VLookup - Vertical lookup. Searches down the first column of a range for a key and returns the value of a specified cell in the row found.
Syntax - VLOOKUP(search_key, range, index, [is_sorted])
- search_key - The value to search for. For example, 42, "Cats", or I24.
- range - The range to consider for the search. The first column in the range is searched for the key specified in search_key.
- index - The column index of the value to be returned, where the first column in range is numbered 1.
- If index is not between 1 and the number of columns in range, #VALUE! is returned.
- is_sorted - [TRUE by default] - Indicates whether the column to be searched (the first column of the specified range) is sorted. FALSE is recommended in most cases.
- It’s recommended to set is_sorted to FALSE. If set to FALSE, an exact match is returned. If there are multiple matching values, the content of the cell corresponding to the first value found is returned, and #N/A is returned if no such value is found.
- If is_sorted is TRUE or omitted, the nearest match (less than or equal to the search key) is returned. If all values in the search column are greater than the search key, #N/A is returned.
In your spreadsheet CoffeeSalesData!I2 to =VLOOKUP($D2,States!$A:$B,2,FALSE)
- Pros
- Data does not have to be sorted
- With sorted data, returns the next smaller value if value not found
- Cons
- Breaks if you add a column to the spreadsheet
- VLOOKUP can only look for data from left to right
- Easy to make a mistake when counting columns
Lookup
Lookup - Looks through a sorted row or column for a key and returns the value of the cell in a result range located in the same position as the search row or column.
Syntax - LOOKUP(search_key, search_range|search_result_array, [result_range])
- search_key - The value to search for in the row or column. For example, 42, "Cats", or I24.
- search_range|search_result_array - One method of using LOOKUP is to provide a single row or column search_range to look through for the search with a second argument result_range. The other way is to combine these two arguments into one search_result_array where the first row or column is searched and a value is returned from the last row or column in the array.
- result_range - [ OPTIONAL ] - The range from which to return a result. The value returned corresponds to the location where search_key is found in search_range. This range must be only a single row or column and should not be used if using the search_result_array method.
- The LOOKUP function will only work properly if data in search_range or search_result_array is sorted. Use VLOOKUP, HLOOKUP, or other related functions if data is not sorted.
- If search_key is not found, the item used in the lookup will be the value that’s immediately smaller in the range provided. For example, if the data set contains the numbers 1, 3, 5 and search_key is 2, then 1 will be used for the lookup.
- In the search_result_array method, the last row or column in the provided range is returned. If a different row or column is desired, use VLOOKUP or HLOOKUP instead.
- When using the search_result_array method, if the range provided contains more columns than rows, then the search will be from left to right over the first row in the range. If the range contains an equal number of rows and columns or more rows than columns, then the search will be from top to bottom over the first column in the range.
Set CoffeeSalesData!J2 to =LOOKUP($D2,States!$A:$A,States!$B:$B)
- Pros
- Does not break if you add a column to the spreadsheet
- Easier to specify data column
- Returns the next smaller value if value not found
- Cons
- Data has to be sorted
Index and Match
Match - Returns the relative position of an item in a range that matches a specified value.
Syntax for Match - MATCH(search_key, range, [search_type])
- search_key - The value to search for. For example, 42, "Cats", or I24.
- range - The one-dimensional array to be searched. - If a range with both height and width greater than 1 is used, MATCH will return #N/A!.
- search_type - [ OPTIONAL - 1 by default ] - The manner in which to search.
- 1, the default, causes MATCH to assume that the range is sorted in ascending order and return the largest value less than or equal to search_key.
- 0 indicates exact match, and is required in situations where range is not sorted.
- -1 causes MATCH to assume that the range is sorted in descending order and return the smallest value greater than or equal to search_key.
- MATCH returns the position in an array or range of a matched value rather than the value itself. To return the value itself or another value corresponding to the row or column the match is found in, use INDEX, HLOOKUP, or VLOOKUP.
Set CoffeeSalesData!K2 to =MATCH($D2,States!$A:$A,0)
Index - Returns the content of a cell, specified by row and column offset.
Syntax for Index - INDEX(reference, [row], [column])
- reference - The array of cells to be offset into.
- row - [OPTIONAL - 0 by default] - The number of offset rows.
- column - [OPTIONAL - 0 by default] - The number of offset columns.
- Normally the row and column offset are not needed.
Using Index and Match
Using Index and Match. Set CoffeeSalesData!L2 to =INDEX(States!$B:$B,MATCH($D2,States!$A:$A,0))
- Pros
- Does not break if you add a column to the spreadsheet
- Easier to specify data column
- Data does not have to be sorted. Set CoffeeSalesData!G2 to
=INDEX(Products!$A:$A,MATCH($E2,Products!$B:$B,0))and CoffeeSalesData!H2 to=F2*G2 - If data is sorted, then the next or previous value can be returned. See search_type in MATCH function. Set GradesData!C2 to
=INDEX($E$2:$E$6,MATCH($B2,$F$2:$F$6,1)) - If data is sorted, returns the next smaller value if value not found
- Better processing speed
- Cons
- User may not be familiar with this technique
October 7, 2021
Entity Relationship Diagrams (Part 1)
Identifying Entities
A good database design starts with a list of the data that you want to include in your database and what you want to be able to do with the database later on.

The types of information that are saved in the database are called 'entities'. These entities exist in four kinds: people, things, events, and locations. Everything you could want to put in a database fits into one of these categories. If the information you want to include doesn't fit into these categories, than it is probably not an entity but a property of an entity, an attribute.
For example, imagine that you are creating a website for a store, what kind of information do you have to deal with? In a store you sell your products to customers. The "Store" is a location; "Sale" is an event; "Products" are things; and "Customers" are people. These are all entities that need to be included in your database.
But what other things are happening when selling a product? A customer comes into the store, approaches the salesperson, asks a question and gets an answer. "Salespersons" also participate, and because salespersons are people, we need a salespersons entity.
Identifying Relationships
The next step is to determine the relationships between the entities and to determine the cardinality of each relationship. The relationship is the connection between the entities, just like in the real world: what does one entity do with the other, how do they relate to each other? For example, customers buy products, products are sold to customers, a sale comprises products, a sale happens in a store.
The cardinality shows how much of one side of the relationship belongs to how much of the other side of the relationship. First, you need to state for each relationship, how much of one side belongs to exactly 1 of the other side. For example: How many customers belong to 1 sale?; How many sales belong to 1 customer?; How many sales take place in 1 store?
Did we mention all relationships? There are four entities and each entity has a relationship with every other entity, so each entity must have three relationships, and also appear on the left end of the relationship three times. Above, 12 relationships were mentioned, which is 4*3, so we can conclude that all relationships were mentioned.
Now we'll put the data together to find the cardinality of the whole relationship. In order to do this, we'll draft the cardinalities per relationship. To make this easy to do, we'll adjust the notation a bit, by noting the 'backward'-relationship the other way around:
- Customers → Sales; 1 customer can buy something several times
- Sales → Customers; 1 sale is always made by 1 customer at the time
The second relationship we will turn around so it has the same entity order as the first. Please notice the arrow that is now faced the other way!
- Customers ← Sales; 1 sale is always made by 1 customer at the time
Cardinality exists in four types: one-to-one, one-to-many, many-to-one, and many-to-many. In a database design this is indicated as: 1:1, 1:N, M:1, and M:N. To find the right indication just leave the '1'. If there is a 'many' on the left side, this will be indicated with 'M', if there is a 'many' on the right side it is indicated with 'N'.
- Customers → Sales; 1 customer can buy something several times; 1:N.
- Customers ← Sales; 1 sale is always made by 1 customer at the time; 1:1.
The true cardinality can be calculated through assigning the biggest values for left and right, for which 'N' or 'M' are greater than '1'. In this example, in both cases there is a '1' on the left side. On the right side, there is a 'N' and a '1', the 'N' is the biggest value. The total cardinality is therefore '1:N'. A customer can make multiple 'sales', but each 'sale' has just one customer.
If we do this for the other relationships too, we'll get:
- Customers → Sales; → 1:N
- Customers → Products; → M:N
- Customers → Stores; → M:N
- Sales → Products; → M:N
- Stores → Sales; → 1:N
- Stores → Products; → M:N
Glossary
- Attributes - detailed data about an entity, such as price, length, name
- Cardinality - the relationship between two entities, in figures. For example, a person can place multiple orders.
- Entities - abstract data that you save in a database. For example: customers, products.
- Foreign key (FK) - a referral to the Primary Key of another table. Foreign Key-columns can only contain values that exist in the Primary Key column that they refer to.
- Key - a key is used to point out records. The most well-known key is the Primary Key (see Primary Key).
- Normalization - A flexible data model needs to follow certain rules. Applying these rules is called normalizing.
- Primary key (PK) - one or more columns within a table that together form a unique combination of values by which each record can be pointed out separately. For example: customer numbers, or the serial number of a product.
- Primary key/Foreign key (PF) - The foreign key of an entity can also be part of the primary key, in that case the attribute will be indicated with 'PF' behind its name. This is usually the case with the link-entities, because you usually link two instances only once together.
October 12, 2021
Entity Relationship Diagrams (Part 2)
Cardinality - Crowsfeet Notation
Relationships have two indicators. The first one (often called multiplicity) refers to the maximum number of times that an instance of one entity can be associated with instances in the related entity. It can be one or many.
The second describes the minimum number of times one instance can be related to others. It can be zero or one, and accordingly describes the relationship as optional or mandatory.
The combination of these two indicators is always in a specific order. Placed on the outside edge of the relationship, the symbol of multiplicity comes first. The symbol indicating whether the relationship is mandatory or optional is shown after the symbol of multiplicity.

In crow’s foot notation:
- A multiplicity of one and a mandatory relationship is represented by a straight line perpendicular to the relationship line.
- A multiplicity of many is represented by the three-pronged ‘crow-foot’ symbol.
- An optional relationship is represented by an empty circle.
This result in four possible relationships:
- zero or many
- one or many
- one and only one
- zero or one
A good database design starts with a list of the data that you want to include in your database and what you want to be able to do with the database later on.

Between the entities there may be a mutual dependency. This means that the one item cannot exist if the other item does not exist. For example, there cannot be a sale if there are no customers, and there cannot be a sale if there are no products.
The relationships Sales → Customers, and Sales → Products are mandatory, but the other way around this is not the case. A customer can exist without sale, and also a product can exist without sale. This is of importance for the next step.
Redundant Relationships
Sometimes in your model you will get a 'redundant relationship'. These are relationships that are already indicated by other relationships, although not directly.
In the case of our example there is a direct relationships between customers and products. But there are also relationships from customers to sales and from sales to products, so indirectly there already is a relationship between customers and products through sales. The relationship 'Customers ↔ Products' is made twice, and one of them is therefore redundant. In this case, products are only purchased through a sale, so the relationships 'Customers ↔ Products' can be deleted. The model will then look like this:

Solving Many-to-Many Relationships
Many-to-many relationships (M:N) are not directly possible in a database. What a M:N relationship says is that a number of records from one table belongs to a number of records from another table. Somewhere you need to save which records these are and the solution is to split the relationship up in two one-to-many relationships.
This can be done by creating a new entity that is in between the related entities. In our example, there is a many-to-many relationship between sales and products. This can be solved by creating a new entity: sales-products. This entity has a many-to-one relationship with Sales, and a many-to-one relationship with Products. In logical models this is called an associative entity and in physical database terms this is called a link table or junction table.

In the example there are two many-to-many relationships that need to be solved: 'Products ↔ Sales', and 'Products ↔ Stores'. For both situations there needs to be created a new entity, but what is that entity?
For the Products ↔ Sales relationship, every sale includes more products. The relationship shows the content of the sale. In other words, it gives details about the sale. So the entity is called 'Sales details'. You could also name it 'sold products'.
The Products ↔ Stores relationship shows which products are available in which the Stores, also known as 'stock'. Our model would now look like this:

Identifying Attributes
The data elements that you want to save for each entity are called 'attributes'.
About the products that you sell, you want to know, for example, what the price is, what the name of the manufacturer is, and what the type number is. About the customers you know their customer number, their name, and address. About the Stores you know the location code, the name, the address. Of the sales you know when they happened, in which store, what products were sold, and the sum total of the sale. Of the Salesperson you know his staff number, name, and address. What will be included precisely is not of importance yet; it is still only about what you want to save.
Derived Data
Derived data is data that is derived from the other data that you have already saved. In this case the 'sum total' is a classical case of derived data. You know exactly what has been sold and what each product costs, so you can always calculate how much the sum total of the sales is. So really it is not necessary to save the sum total.
So why is it saved here? Well, because it is a sale, and the price of the product can vary over time. A product can be priced at $10 today and at $8 next month, and for your administration you need to know what it cost at the time of the sale, and the easiest way to do this is to save it here.
Glossary
- Attributes - detailed data about an entity, such as price, length, name
- Cardinality - the relationship between two entities, in figures. For example, a person can place multiple orders.
- Entities - abstract data that you save in a database. For example: customers, products.
- Foreign key (FK) - a referral to the Primary Key of another table. Foreign Key-columns can only contain values that exist in the Primary Key column that they refer to.
- Key - a key is used to point out records. The most well-known key is the Primary Key (see Primary Key).
- Normalization - A flexible data model needs to follow certain rules. Applying these rules is called normalizing.
- Primary key (PK) - one or more columns within a table that together form a unique combination of values by which each record can be pointed out separately. For example: customer numbers, or the serial number of a product.
- Primary key/Foreign key (PF) - The foreign key of an entity can also be part of the primary key, in that case the attribute will be indicated with 'PF' behind its name. This is usually the case with the link-entities, because you usually link two instances only once together.
October 14, 2021
Entity Relationship Diagrams (Part 3)
Primary Keys
A primary key (PK) is one or more data attributes that uniquely identify an entity. A key that consists of two or more attributes is called a composite key. All attributes part of a primary key must have a value in every record (which cannot be left empty) and the combination of the values within these attributes must be unique in the table.
In the example there are a few obvious candidates for the primary key. Customers all have a customer number, products all have a unique product number and the sales have a sales number. Each of these data is unique and each record will contain a value, so these attributes can be a primary key. Often an integer column is used for the primary key so a record can be easily found through its number.
Link-entities usually refer to the primary key attributes of the entities that they link. The primary key of a link-entity is usually a collection of these reference-attributes. For example in the Sales_details entity we could use the combination of the PK's of the sales and products entities as the PK of Sales_details. In this way we enforce that the same product (type) can only be used once in the same sale. Multiple items of the same product type in a sale must be indicated by the quantity.
In the ERD the primary key attributes are indicated by the text 'PK' behind the name of the attribute. In the example only the entity 'store' does not have an obvious candidate for the PK, so we will introduce a new attribute for that entity: storenumber.
Foreign Keys
The Foreign Key (FK) in an entity is the reference to the primary key of another entity. In the ERD that attribute will be indicated with 'FK' behind its name. The foreign key of an entity can also be part of the primary key, in that case the attribute will be indicated with 'PF' behind its name. This is usually the case with the link-entities, because you usually link two instances only once together (with 1 sale only 1 product type is sold 1 time).
If we put all link-entities, PK's and FK's into the ERD, we get the model as shown below. Please note that the attribute 'products' is no longer necessary in 'Sales', because 'sold products' is now included in the link-table. In the link-table another field was added, 'quantity', that indicates how many products were sold. The quantity field was also added in the stock-table, to indicate how many products are still in store.

Defining the Attribute's Data Type
Now it is time to figure out which data types need to be used for the attributes. There are a lot of different data types. A few are standardized, but many databases have their own data types that all have their own advantages. Some databases offerthe possibility to define your own data types, in case the standard types cannot do the things you need.
Okay, time for a crash course:
The standard data types that every database knows, and are most-used, are: CHAR, VARCHAR, TEXT, FLOAT, DOUBLE, and INT. Normally, we use signed integers instead of unsigned integers.
Text:
- CHAR(length) - includes text (characters, numbers, punctuations...). CHAR has as characteristic that it always saves a fixed amount of positions. If you define a CHAR(10) you can save up to ten positions maximum, but if you only use two positions the database will still save 10 positions. The remaining eight positions will be filled by spaces (max 255 characters).
- VARCHAR(length) - includes text (characters, numbers, punctuation...). VARCHAR is the same as CHAR, the difference is that VARCHAR only takes as much space as necessary (max 255 characters).
- TEXT - can contain large amounts of text (max 65,535 characters).
- MEDIUMTEXT - can contain large amounts of text (max 16,777,215 characters).
- LONGTEXT - can contain large amounts of text (max 4,294,967,295 characters).
Numbers:
- TINYINT - contains a positive or negative whole number -128 to 127 SIGNED or 0 to 255 UNSIGNED (1 byte)
- SMALLINT - contains a positive or negative whole number -32768 to 32767 SIGNED or 0 to 65535 UNSIGNED (2 bytes)
- MEDIUMINT - contains a positive or negative whole number -8388608 to 8388607 SIGNED or 0 to 16777215 UNSIGNED (3 bytes)
- INT - contains a positive or negative whole number -2147483648 to 2147483647 SIGNED or 0 to 4294967295 UNSIGNED (4 bytes)
- BIGINT - contains a positive or negative whole number -9223372036854775808 to 9223372036854775807 SIGNED or 0 to 18446744073709551615 UNSIGNED (8 bytes)
- FLOAT(size,d) - A number with a floating decimal point. The maximum number of digits may be specified in the size parameter. The maximum number of digits to the right of the decimal point is specified in the d parameter (4 bytes, approximately 7 significant digits).
- DOUBLE(size,d) - A number with a floating decimal point. The maximum number of digits may be specified in the size parameter. The maximum number of digits to the right of the decimal point is specified in the d parameter (8 bytes, approximately 14 significant digits).
Date and Time:
- DATE - A date. Format: YYYY-MM-DD Note: The supported range is from '1000-01-01' to '9999-12-31' (3 bytes)
- DATETIME - A date and time combination. Format: YYYY-MM-DD HH:MI:SS Note: The supported range is from '1000-01-01 00:00:00' to '9999-12-31 23:59:59' (5 bytes)
- TIMESTAMP - number of seconds since the Unix epoch ('1970-01-01 00:00:00' UTC). Format: YYYY-MM-DD HH:MI:SS Note: The supported range is from '1970-01-01 00:00:01' UTC to '2038-01-09 03:14:07' UTC (4 bytes). In an INSERT or UPDATE query, the TIMESTAMP automatically set itself to the current date and time.
- TIME - A time. Format: HH:MI:SS Note: The supported range is from '-838:59:59' to '838:59:59' (3 bytes)
- YEAR - A year in two-digit or four-digit format. Note: Values allowed in four-digit format: 1901 to 2155. Values allowed in two-digit format: 70 to 69, representing years from 1970 to 2069 (1 byte)
Other types:
- BLOB - for binary data such as files (max 65,535 characters).
- MEDIUMBLOB - for binary data such as files (max 16,777,215 characters).
- LARGEBLOB - for binary data such as files (max 4,294,967,295 characters).
For our example the data types are as follows:

Glossary
- Attributes - detailed data about an entity, such as price, length, name
- Cardinality - the relationship between two entities, in figures. For example, a person can place multiple orders.
- Entities - abstract data that you save in a database. For example: customers, products.
- Foreign key (FK) - a referral to the Primary Key of another table. Foreign Key-columns can only contain values that exist in the Primary Key column that they refer to.
- Key - a key is used to point out records. The most well-known key is the Primary Key (see Primary Key).
- Normalization - A flexible data model needs to follow certain rules. Applying these rules is called normalizing.
- Primary key (PK) - one or more columns within a table that together form a unique combination of values by which each record can be pointed out separately. For example: customer numbers, or the serial number of a product.
- Primary key/Foreign key (PF) - The foreign key of an entity can also be part of the primary key, in that case the attribute will be indicated with 'PF' behind its name. This is usually the case with the link-entities, because you usually link two instances only once together.
Homework
Review: Crash Course in Binary Numbers
October 19, 2021
Entity Relationship Diagrams (Part 4)
Normalization
Normalization makes your data model flexible and reliable. It does generate some overhead because you usually get more tables, but it enables you to do many things with your data model without having to adjust it.
Normalization, the First Form
The first form of normalization states that there may be no repeating groups of columns in an entity. We could have created an entity 'sales' with attributes for each of the products that were bought. This would look like this:

What is wrong about this is that now only 3 products can be sold. If you would have to sell 4 products, than you would have to start a second sale or adjust your data model by adding 'product4' attributes. Both solutions are unwanted. In these cases you should always create a new entity that you link to the old one via a one-to-many relationship.

Normalization, the Second Form
The second form of normalization states that all attributes of an entity should be fully dependent on the whole primary key. This means that each attribute of an entity can only be identified through the whole primary key. Suppose we had the date in the Sales_details entity:

This entity is not according the second normalization form, because in order to be able to look up the date of a sale, I do not have to know what is sold (productnumber), the only thing I need to know is the sales number. This was solved by splitting up the tables into the sales and the Sales_details table:

Now each attribute of the entities is dependent on the whole PK of the entity. The date is dependent on the sales number, and the quantity is dependent on the sales number and the sold product.
Normalization, the Third Form
The third form of normalization states that all attributes need to be directly dependent on the primary key, and not on other attributes. This seems to be what the second form of normalization states, but in the second form is actually stated the opposite. In the second form of normalization you point out attributes through the PK, in the third form of normalization every attribute needs to be dependent on the PK, and nothing else.

In this case the price of a loose product is dependent on the ordering number, and the ordering number is dependent on the product number and the sales number. This is not according to the third form of normalization. Again, splitting up the tables solves this.

Normalization, More Forms
There are more normalization forms than the three forms mentioned above, but those are not of great interest for the average user. These other forms are highly specialized for certain applications. If you stick to the design rules and the normalization, you will create a design that works great for most applications.
Normalized Data Model
If you apply the normalization rules, you will find that the 'manufacturer' in the product table should also be a separate table:

Glossary
- Attributes - detailed data about an entity, such as price, length, name
- Cardinality - the relationship between two entities, in figures. For example, a person can place multiple orders.
- Entities - abstract data that you save in a database. For example: customers, products.
- Foreign key (FK) - a referral to the Primary Key of another table. Foreign Key-columns can only contain values that exist in the Primary Key column that they refer to.
- Key - a key is used to point out records. The most well-known key is the Primary Key (see Primary Key).
- Normalization - A flexible data model needs to follow certain rules. Applying these rules is called normalizing.
- Primary key (PK) - one or more columns within a table that together form a unique combination of values by which each record can be pointed out separately. For example: customer numbers, or the serial number of a product.
- Primary key/Foreign key (PF) - The foreign key of an entity can also be part of the primary key, in that case the attribute will be indicated with 'PF' behind its name. This is usually the case with the link-entities, because you usually link two instances only once together.
October 21, 2021
Advanced Spreadsheet Analysis
Files you will need for this exercise:
- Orders.csv
- OrderDetails.csv
- Suppliers.csv
- Products.csv
- Categories.csv
- Customers.csv
- Shippers.csv
- Employees.csv
- EmployeesTerritories.csv
- Territories.csv
- Region.csv
You will also need the Northwind ERD
When analyzing data, you want to develop a spreadsheet that can be used for different periods of data. Often you get data monthly, and you would like to import the data without having to re-enter the calculations.
In this analysis, we are going to look at the number of products sold and the dollar amount of the products sold. Look at your ERD diagram and see the OrderDetailt table. It has the counts and unit price of each item sold.
- Create a spreadsheet called "Advanced Analysis"
- Create a sheet called "Report"
- Create a sheet called "Temp"
- Import the OrderDetails.csv file into a sheet called OrderDetails
As previously stated, don't want to do any direct calculations in the data, so we will make a copy of the data in the Temp sheet. Enter the following in the Temp Sheet:
- Cell A1 - OrderDetails.OrderID
- Cell A2 -
=OrderDetails!A2 - Cell B1 - OrderDetails.ProductID
- Cell B2 -
=OrderDetails!B2 - Cell C1 - OrderDetails.UnitPrice
- Cell C2 -
=OrderDetails!C2 - Cell D1 - OrderDetails.Quantity
- Cell D2 -
=OrderDetails!D2 - Cell E1 - OrderDetails.Discount
- Cell E2 -
=OrderDetails!E2
Now we will calculate the Amount of the Order Detail. It is the Quantity times the Unit Price minus the discount:
- Cell F1 - OrderDetails.Amount
- Cell F2 -
=(C2*D2) - ((C2*D2)*E2)
Let's work on the category of the product. We already have the Product ID (Column B in Temp sheet). We can then go to the Products sheet, lookup a product using the Product ID (Colunn A in Products sheet) and find the CategoryID (Column D in the Products sheet). The CategoryID is now in column G of the Temp sheet.
- Import the Products.csv file into a sheet called Products
- Cell G1 - Product.CategoryID
- Cell G2 -
=INDEX(Products!$D:$D,MATCH(B2,Products!$A:$A))
Now that we have the CategoryID in column G of the Temp sheet, we can find the CategoryName. We can then go to the Categories sheet, lookup a category using the CategoryID (Colunn G in Categories sheet) and find the CategoryName (Column B in the Categories sheet). The CategoryName is now in column H of the Temp sheet.
- Import the Categories.csv file into a sheet called Categories
- Cell H1 - Categories.CategoryName
- Cell H2 -
=INDEX(Categories!$B:$B,MATCH(G2,Categories!$A:$A))
Now duplicate all of your calculations in the Temp sheet, down to row 2156. You will notice that Google Sheets add rows to the bottom of a sheet in chunks of 1000. Press the add 1000 rows to add more rows to the sheet.
Let's put together the body of the report. Go to the Report sheet and enter the following:
- Cell A1 - Category
- Cell B1 - Units
- Cell C1 - Sales
- Cell D1 - Sales Rank
- Cell A2 -
=SORT(Categories!B2:B,1,true) - Cell B2 -
=SUMIFS(Temp!$D$2:$D,temp!$H$2:$H,"="&A2) - Cell C2 -
=SUMIFS(Temp!$F$2:$F,temp!$H$2:$H,"="&A2) - Cell D2 -
=RANK(C2,$C$2:$C)- Also, add a conditional format that highlights the 1st, 2nd, and 3rd highest ranking. You will have to add 3 conditions. - Duplicate the formulas in B2:D2 through B9:D9
- Cell F8 - Total Units
- Cell G8 -
=SUM($B$2:$B) - Cell F9 - Total Sales
- Cell G9 -
=SUM($C$2:$C)
Here is a link to the Advanced Analysis Spreadsheet
October 26, 2021
Advanced Spreadsheet Analysis - Continued
We have a great looking report, but now we would like to add a date range based on the order date. We can go to the Temp sheet, lookup a an order using the OrderID (Column A in Orders sheet) and find the OrderDate (Column D in the Orders sheet). The OrderDate is now in column I of the Temp sheet.
- Import the Orders.csv file into a sheet called Orders
- Cell I1 - Orders.OrderDate
- Cell I2 -
=INDEX(Orders!$D:$D,MATCH(A2,Orders!$A:$A)) - Duplicate all of your calculations in the Temp sheet, down to row 2156.
Let's go back to the Report Sheet and add the following to use the OrderDate:
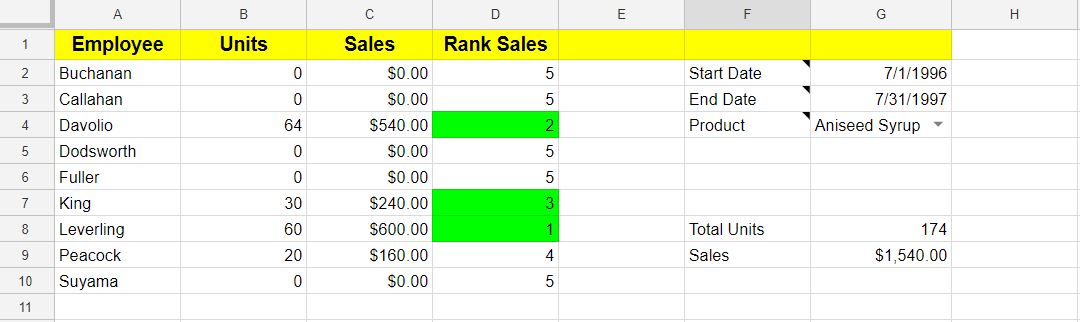
- Cell F2 - Start Date
- Cell G2 - 7/1/1996 - add Validation to ensure that a date has been entered
- Cell F3 - End Date
- Cell G3 - 7/1/1997 - add Validation to ensure that a date has been entered
- Cell B2 -
=SUMIFS(Temp!$D$2:$D,Temp!$H$2:$H,"="&A2,Temp!$I$2:$I,">="&$G$2,Temp!$I$2:$I,"<="&G$3) - Cell C2 -
=SUMIFS(Temp!$F$2:$F,Temp!$H$2:$H,"="&A2,Temp!$I$2:$I,">="&$G$2,Temp!$I$2:$I,"<="&G$3)
Almost done. We would also limit the data to specific customer. We can go to the Temp sheet, lookup a an order using the OrderID (Column A in Orders sheet) and find the CustomerID (Column B in the Orders sheet). The CustomerID is now in column J of the Temp sheet. While it is nice to have the CustomerID, it would be more readable to have the CompanyName. We can go to the Temp sheet, lookup an Customer using the CustomerID (Column A in Customers sheet) and find the CompanyName (Column B in the Customers sheet). The CompanyName is now in column K of the Temp sheet.
- Cell J1 - Orders.CustomerID
- Cell J2 -
=INDEX(Orders!$B:$B,MATCH(A2,Orders!$A:$A)) - Import the Customers.csv file into a sheet called Customers
- Cell K1 - Customers.CompanyName
- Cell K2 -
=INDEX(Customers!$B:$B,MATCH(J2,Customers!$A:$A)) - Duplicate all of your calculations in the Temp sheet, down to row 2156.
- Report Sheet Cell F4 - Customer Name
- Report Sheet Cell G4 - Create a data validation dropdown using a list of value from Temp!K2:K2156
- Report Sheet Cell B2 -
=SUMIFS(Temp!$D$2:$D,Temp!$H$2:$H,"="&A2,Temp!$I$2:$I,">="&$G$2,Temp!$I$2:$I,"<="&G$3,Temp!$K$2:$K,"="&$G$4) - Report Sheet Cell C2 -
=SUMIFS(Temp!$F$2:$F,Temp!$H$2:$H,"="&A2,Temp!$I$2:$I,">="&$G$2,Temp!$I$2:$I,"<="&G$3,temp!$K$2:$K,"="&$G$4)
Everything looks good, except that the dropdown for CompanyNames are not sorted. Let's create a sorted column:
- Cell L1 - Customers.SortedCompanyName
- Cell K2 -
=Sort(K2:K,1,true) - Duplicate all of your calculations in the Temp sheet, down to row 2156.
- Report Sheet Cell G4 - Modify a data validation dropdown using a list of value from Temp!L2:L2156
One final enhancement. Add a sheet called "Chart". Create a pie chart that displays the categories and sales amount.
Here is a link to the Advanced Analysis Spreadsheet - Final Version
Using the Northwind data and the Northwind ERD, create a spreadsheet that shows number of units and sales by employee. You should be able to enter from and to date for the date of the sales order and select a specific product. Conditionally format the rank of the top 3 employess. Create a pie chart of the sales and employees.
October 28, 2021
Practice Spreadsheet Assessment Review
Practice Assessment Solution
- Create a spreadsheet called "Practice Assessment Solution"
- Create a sheet called "Report"
- Create a sheet called "Temp"
- Import the OrderDetails.csv file into a sheet called OrderDetails
Order Detail Calculations
- Cell A1 - OrderDetails.OrderID
- Cell A2 -
=OrderDetails!A2 - Cell B1 - OrderDetails.ProductID
- Cell B2 -
=OrderDetails!B2 - Cell C1 - OrderDetails.UnitPrice
- Cell C2 -
=OrderDetails!C2 - Cell D1 - OrderDetails.Quantity
- Cell D2 -
=OrderDetails!D2 - Cell E1 - OrderDetails.Discount
- Cell E2 -
=OrderDetails!E2 - Cell F1 - OrderDetails.Amount
- Cell F2 -
=(C2*D2) - ((C2*D2)*E2)
Use Orders sheet to get the EmployeeID.
- Import the Orders.csv file into a sheet called Orders
- Cell G1 - Orders.Employee
- Cell G2 -
=INDEX(Orders!$C:$C,MATCH(A2,Orders!$A:$A))
Use Employees sheet to get the employee's LastName.
- Import the Employees.csv file into a sheet called Employees
- Cell H1 - Employee.LastName
- Cell H2 -
=INDEX(Employees!$B:$B,MATCH(G2,Employees!$A:$A))
Use Orders sheet to get the Order Date
- Cell I1 - Orders.OrderDate
- Cell I2 -
=INDEX(Orders!$D:$D,MATCH(A2,Orders!$A:$A))
Use Products sheet to get the ProductName.
- Import the Products.csv file into a sheet called Products
- Cell J1 - Products.ProductName
- Cell J2 -
=INDEX(Products!$B:$B,MATCH(B2,Products!$A:$A))
Duplicate Columns A-J in the Temp sheet, down to row 2156.
Create a column with the Products in sorted order
- Cell K1 - Products.SortedProductName
- Cell K2 -
=SORT(J2:J,1,true)
Report Sheet:
- Cell A1 - Employee
- Cell B1 - Units
- Cell C1 - Sales
- Cell D1 - Sales Rank
- Cell A2 -
=Sort(Employees!B2:B,1,true) - Cell F2 - Starting Date
- Cell G2 - 7/1/1996
- Cell F3 - Ending Date
- Cell G3 - 7/1/1997
- Cell F4 - Product
- Report Sheet Cell G4 - Modify a data validation dropdown using a list of value from Temp!K2:K2156
- Cell B2 -
=SUMIFS(Temp!$D$2:$D,Temp!$H$2:$H,"="&A2,Temp!$I$2:$I,">="&$G$2,Temp!$I$2:$I,"<="&$G$3,Temp!$J$2:$J,"="&$G$4) - Cell C2 -
=SUMIFS(Temp!$F$2:$F, Temp!$H$2:$H,"="&A2,Temp!$I$2:$I,">="&$G$2,Temp!$I$2:$I,"<="&$G$3,Temp!$J$2:$J,"="&$G$4) - Cell D2 -
=RANK(C2,$C$2:$C)- Also, add a conditional format that highlights the 1st, 2nd, and 3rd highest ranking - Duplicate the formulas in B2:D2 through B9:D9
- Cell F8 - Total Units
- Cell G8 -
=SUM($B$2:$B) - Cell F9 - Total Sales
- Cell G9 -
=SUM($C$2:$C)
One final enhancement. Add a sheet called "Chart". Create a pie chart that displays the categories and sales amount.
Here is a link to the Practice Spreadsheet Assessent
November 2, 2021
ITEC 4610 Presentations
Presentations
- Meet in the CSTEM Auditorium
- Project Presentations
- Guest Link for Presentations: https://us.bbcollab.com/guest/6cb54e38c9e84bb2a82697f4c17aebb7
- Dial in: +1-571-392-7650 PIN: 549 559 0316
- ITEC 3610 will return to EIT 219 after the presentations
Novemer 4, 2021
Spreadsheet Assessment
November 9, 2021
Web Form Submission
Input Type="Text"
Input Type="Password"
Input Type="Reset"
Input Type="Radio"
Input Type="Checkbox"
Input Type="Select"
Assignment - Due November 16 at the beginning of class - In your development environment, create a new subproject called Validation. As closely as possible, create the web form in index.html using the image below. When complete, you should be able to see the values when you submit the form. You will need this assignment for your next class period.
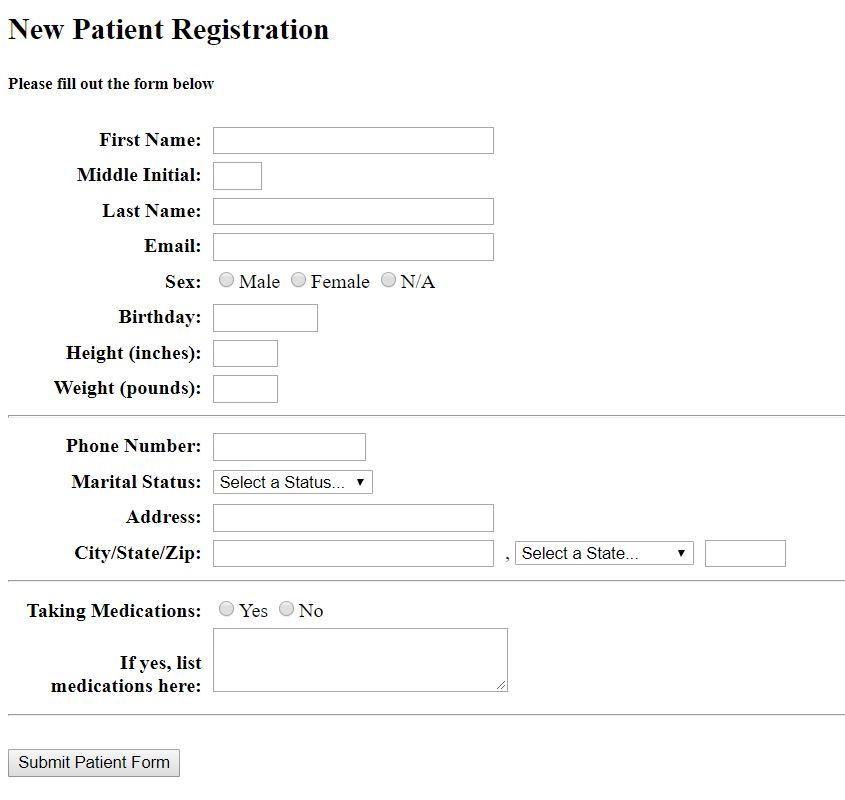
- Form Action - https://brucebauer.info/assets/ITEC3650/datadump.php
- First Name - name=FirstName, size=30, maxlength=30
- Middle Initial - name=MiddleInitial, size=1, maxlength=1
- Last Name - name=LastName, size=30, maxlength=30
- Email - name=Email, size=30, maxlength=30
- Sex - name=Sex
- Male returns "M"
- Female returns "F"
- N/A returns "N"
- Birthday - name=Birthday, size=8, maxlength=8
- Height - name=Height, size=3, maxlength=3
- Weight - name=Weight, size=3, maxlength=3
- Phone Number - name=PhoneNumber, size=14, maxlength=14
- Marital Status - name=MaritalStatus
- Single returns "S"
- Married returns "M"
- Divorced returns "D"
- Legally Separated returns "L"
- Widowed returns "W"
- Address - name=Address, size=30, maxlength=30
- City - name=City, size=30, maxlength=30
- State - name=State, size=3, Displays long state name, returns 2 character state code. (Hint: search "html state dropdown" to eliminate some typing)
- Zip - name=Zip, size=5, maxlength=5
- Taking Medications - name=Medications
- Yes returns "Y"
- No returns "N"
- Medications - name=MedicationsList, rows=3, cols=30
How do I force the labels to be right justified?
Create the following class in your .CSS file and add the class to each form label. You may have to adjust the width based on the length of your lables.
 .formlabel {
        display: inline-block;
        width: 150px;
        text-align: right;
        padding: 5px;
        font-weight: bold;
    }
November 11, 2018
In-Class Lab
- Work on Webform
November 16, 2021
JQuery
You can include the latest version of JQuery using the following snippet:
JQuery Validation
- jQuery Validation Home
- jQuery Validation Documentation
- Example of jQuery Validation
- JQuery Validators
- data-rule-required="true" – Makes the element required
- data-rule-minlength="10" – Makes the element require a given minimum length
- data-rule-maxlength="20" – Makes the element require a given maximum length
- data-rule-min="2" – Makes the element require a given minimum
- data-rule-max="10" – Makes the element require a given maximum
- data-rule-email="true" – Makes the element require a valid email
- data-rule-url="true" – Makes the element require a valid url
- data-rule-date="true" – Makes the element require a date (MM/DD/YYYY)
- data-rule-dateISO="true" – Makes the element require an ISO date (YYYY-MM-DD)
- data-rule-number="true" – Makes the element require a decimal number
- data-rule-digits="true" – Makes the element require digits only
- data-rule-creditcard="true" – Makes the element require a credit card number
- data-rule-phoneUS="true" – Validate for valid US phone number
- data-msg-required="First Name is Required"
- data-msg-minlength="Password must be at least 10 characters"
- data-msg-maxlength="Address must be less than 20 characters"
- data-msg-min="Age must be 18 years or greater"
- data-msg-max="You can purchase only 5 items"
- data-msg-email="Invalid Email"
- data-msg-url="Invalid URL - example: http://google.com"
- data-msg-date="Date must be MM/DD/YYYY format"
- data-msg-dateISO="Date must be YYYY-MM-DD format"
- data-msg-number="You must enter a decimal number"
- data-msg-digits="Must be an integer"
- data-msg-creditcard="Invalid Credit Card"
- data-msg-phoneUS="Invalid Phone Number"r
- The default is to place the message next to the element being validated
- You can place the error message anywhere on for by
- Using a "Label" tag
- Using the "for" attribute where the value is the "Name" of the field (not the "id")
- Using the error class
- You can style the error message using the error class in CSS
You can include the latest version of JQuery Validation using the following snippet:
<script src="https://cdn.jsdelivr.net/npm/jquery-validation@1.19.1/dist/jquery.validate.min.js"></script>
<script src="https://cdn.jsdelivr.net/npm/jquery-validation@1.19.1/dist/additional-methods.min.js"></script>
Note that JQuery Validation requires an empty validator. JQuery Validation is powerful and you can add your own custom javascript for validation. For these exercises, we won't be doing using any custom javascript, but you will have to ahve a empty validator. To do this, you will add the following code to your project, using the name of your form. Here is an example:
<form id="MyFormName" action="https://brucebauer.info/assets/ITEC3650/datadump.php">

</form>
<script>
$( "#MyFormName" ).validate({

});
</script>
Input Type="Text"
Input Type="Radio"
Input Type="Select"
Assignment - Due Thursday, December 2, at end of day - Using the Validation assignment, add the following validators:
- First Name - required
- Middle Initial - none
- Last Name - required
- Email - required, email
- Sex - required
- Birthday - required, date
- Height - required, number, minimum 12, maximum 120
- Weight - required, number, minimum 10, maximum 500
- Phone Number - required, US Phone
- Marital Status - required
- Address - required
- City - required
- State - required
- Zip - required, 5 digits
- Taking Medications - required
- Medications - none
November 18, 2021
In-Class Lab
- Work on Webform
November 23, 2021
Thanksgiving Break
- Thanksgiving Break - No Classes
November 25, 2021
Thanksgiving Break
- Thanksgiving Break - No Classes
November 30, 2021
Speeches
- Speeches
December 2, 2021
Speeches
- Speeches